

The Census Bureau’s annual poverty and incomes report contained mixed news. Census reported median incomes rose almost $3,000 in 2015.
However, the media reported median incomes remain below 2000 levels. Many analysts explained the Census figures show American incomes have stagnated for a decade and a half. Politicians in both parties now frequently make this claim.
They are wrong. The recession and recovery have been very painful. But most workers enjoy considerably higher incomes today than in 2000. The Census Bureau figures have several shortcomings:
1) They do not adjust for changing household sizes;
2) They measure cash earnings, not benefits, and ignore taxes;
3) They use a less accurate measure of inflation; and
4) They ignore the aging of the population.
All these factors artificially depress measured household income.
Census Is Not Adjusting Its Numbers Properly
Americans are marrying later in life and having fewer children. This reduces household sizes, and measured household incomes. When two single adults marry, they form one household with combined earnings. If they take longer to get married, they remain two separate households with smaller separate incomes. Falling household sizes mechanically reduce household incomes, even if no one’s earnings actually change.
Furthermore, Americans now receive a third of their total compensation as employer benefits, such as health insurance or 401(k) contributions. Many households receive subsidies from taxpayers, too, such as food stamps or Medicaid. Also, of course government taxes some earnings away. The Census figures ignore how these benefits and taxes affect any household’s real resources.
The Census Bureau also adjusts for inflation using the Consumer Price Index (CPI). However, economists have found the CPI overstates inflation. Among other problems, it adjusts to changing consumer behavior slowly (such as Americans buying more gas as it becomes less expensive).
Finally, the Census estimates do not account for America’s aging population. Millions of Americans are retiring from the workforce, and retirees have lower incomes than workers. That fact says little about the health of the economy. Older Americans having lower incomes in retirement does not mean younger workers are worse off.
Better Numbers Are Available
Fortunately the Congressional Budget Office also estimates household incomes. The CBO estimates adjust for changes in household size, include benefits and taxes, and use the most accurate measure of inflation available. The CBO also produces separate estimates for elderly households, households with children, and non-elderly households without children.
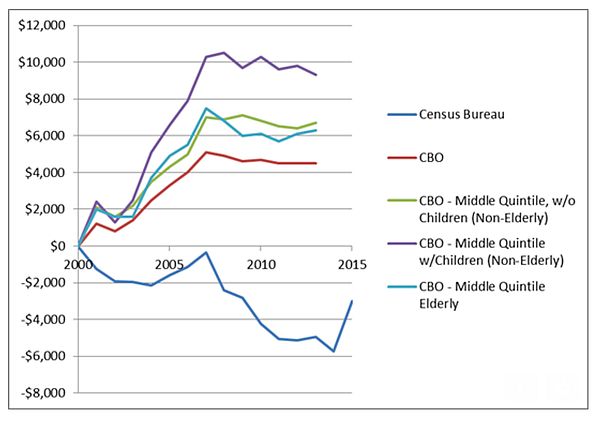
Census’s figures show median household incomes fell $3,000 between 2000 and 2015 (after adjusting for recent changes in the survey methodology). The superior CBO estimates show median household incomes rose $4,500 between 2000 and 2013 (the most recent data available). When the CBO updates its figures through 2015, it will show even greater growth.
Things get really interesting when CBO breaks their estimates down by demographic groups. Looking only at the middle 20 percent of households, incomes in households with children grew $9,300 between 2000 and 2013. Incomes for non-elderly households without children grew $6,700. Elderly households’ incomes also grew $6,300. Each demographic group saw faster income growth than America as a whole.
That happened because retired Americans have lower incomes than workers. Aging among Baby Boomers has moved more Americans into the “elderly household” category, which has lower incomes overall. These demographic shifts push down average income growth. But even among the elderly, after-tax incomes grew considerably.
However, that growth stopped in 2007. CBO data shows that median household incomes overall, and middle quintile incomes across all three demographic groups, fell between 2007 and 2013. To most Americans, the income growth of the mid-2000s is a distant memory. During and after the Great Recession, incomes shrunk. Extrapolating from the recent Census data suggests that incomes only exceeded pre-recession levels last year.
Many Americans are frustrated with stagnant incomes. But this stagnation is limited to the post-crash period. Most Americans are in fact considerably better off today than they were 16 years ago.