Despite the increasingly grim outlook for their party in the 2014 midterms, conventional wisdom holds that Democrats will head into 2016 favored to win the presidency for the fifth time in seven elections. There are reasons for this optimism. Democrats have carried the national popular vote in five of the last six elections, and like Republicans in the years of their dominance of the White House from 1952 to 1988, Democrat control of California gives them a natural head start to win the Electoral College. Democrats appear likely to unify behind a nominee, Hillary Clinton, who would start out not only with historically unique status as the first woman nominated for the presidency by a major party, but also massive name recognition, a strong fundraising network, and leads in most early polls against a fragmented Republican field with no obvious front-runner.
Reams have been written about the nature of the Obama-era Democrats’ political coalition and the difficulty Republicans will have in unsettling it. Most Democratic-leaning pundits insist confidently that losses in the 2014 midterms, like Democratic losses in the 2010 midterms, will be irrelevant in the following presidential election because they are merely a symptom of low midterm turnout and do not signify any shift in the wider presidential-year general electorate’s partisan preferences.
These are all factors worthy of consideration. But any intelligent discussion of 2016 must begin with the fact that history is very strongly against the Democrats in 2016. In the modern two-party era (beginning with the first Republican Party presidential campaign in 1856), there have been 16 elections following the re-election of an incumbent president; in 11 of those races, there was no incumbent on the ballot. An analysis of those elections shows a startlingly uniform pattern over time: the incumbent party (i.e., the party that won the last election) consistently lost ground relative to the challenger party (the party out of power), especially when running without an incumbent on the ballot. And in nearly every such election, that loss of popular support was evident in closely-divided battleground states, rather than confined to uncompetitive states. The trend has persisted in winning and losing elections, in elections with and without third-party challengers, in times of war and peace, booms and depressions. It has become more, rather than less, pronounced in the years since World War II, and at all times has been more pronounced when the incumbent party is the Democrats.
Given the narrow margin for error enjoyed by President Obama in 2012, a swing of a little less than 3 points in the two-party vote would hand the White House to the Republicans—and swings of that size are far more the rule than the exception. In fact, looking at the two-party vote, no non-incumbent since Ulysses S. Grant in 1868 has lost less than 3 points off the prior re-elected incumbent’s showing. If Hillary Clinton wins the presidency in 2016, it will be a historically unprecedented event in more ways than just her gender.
The Natural Equilibrium of the Two Party System
The history of American politics since 1856 (and to some extent before then) has been one in which the two parties are in a precarious equilibrium, even in periods of apparent one-party dominance. There are a number of reasons for this, the simplest explanation being that governing exposes a coalition’s internal tensions and, as the saying goes, friends come and go, but enemies accumulate. The longer you are in power, the more people come up with reasons to blame you for things and consider giving the other guy a chance. The natural American distrust of our political class and distaste for permanent ruling parties is also an ingrained factor.
One way in which this dynamic plays out is the tendency of the party holding the White House to lose seats in Congress in the midterm elections. Another is the tendency of the governing coalition to lose support to the party out of power—a centrifugal force so consistent that parties have historically held the White House for more than eight years at a time only when they have assembled a coalition broad enough to sustain consistent losses for multiple elections in a row without ending up with fewer votes than the other party—i.e., below 50 percent of the two-party vote.
About that two-party vote: in looking at the share of the vote won by a presidential candidate, you have two choices. You can use a percentage of the total votes cast, or you can throw out the votes for third-party candidates and use a percentage of the votes that were cast for the two major party candidates—thus, the two-party vote. Both measures have uses for different purposes, but because every election in U.S. history has been won by a major-party candidate, very few third-party candidates even win a single state, and almost no third-party movements persist beyond a single election cycle, the two-party vote is the better measurement of the two parties’ relative odds of actually winning an election. For the analyses that follow, therefore, I use the two-party vote as the relevant measure, except where otherwise noted, although the charts in this and the next, related article also provide the overall popular-vote percentages for comparison purposes.
Incumbents Are a Tough Act to Follow
There is extensive and well-known literature on the advantages of incumbency in presidential elections, ranging from name recognition to the ability to affect events from the Oval Office to advantages in building a campaign operation (you can see a sampling here, here, here, and here). Those advantages may well be growing as campaigns become more expensive and voter contact and turnout technology more sophisticated. We heard a lot about the advantages of incumbency in 2012, as the Obama campaign raised and spent over a billion dollars, used its resources to build an unparalleled polling and Big Data operation, and saturated a variety of media with ads and messages designed to define Mitt Romney early. But what happens when a political party tries to repeat the results of a re-election campaign without the advantages of incumbency?
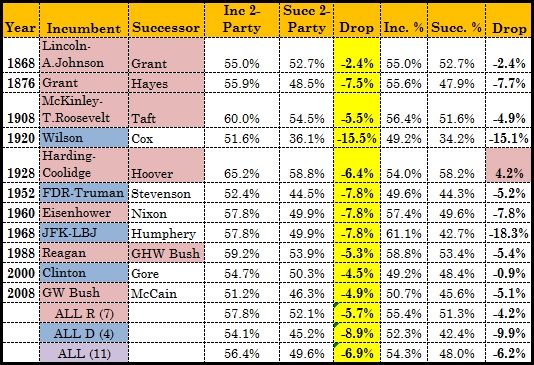
Let’s start with the 11 previous elections (since 1856) in which (1) there was no incumbent on the ballot and (2) an incumbent had been re-elected in the prior election. Those 11 elections thus provide an apples-to-apples comparison for the task the Democrats will face in trying to replicate Obama’s 2012 performance without an incumbent on the ticket.
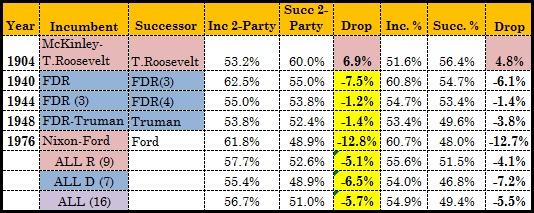
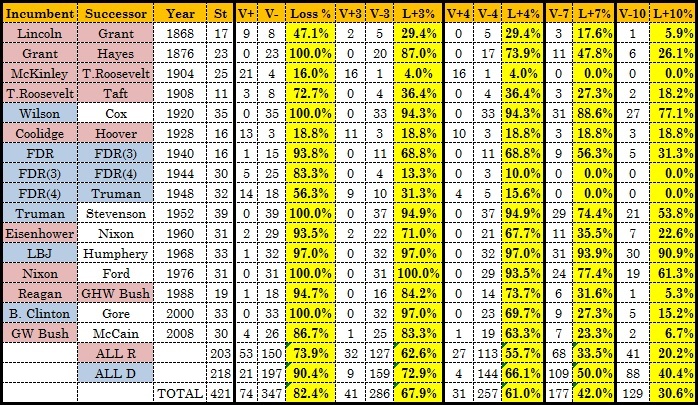
Here’s a table of those 11 elections, showing the change in the incumbent party’s share of the two-party vote and overall vote share. At first glance, this may not seem all that alarming, given that the incumbent party won the next election six out of 11 times (all of them Republicans, and all but one of them before FDR). But those parties had all claimed between 55 to 65 percent of the two-party vote in the previous election, while Obama in 2012 won a shade under 52 percent. Look at the two-party vote shares and you will see that all 11 lost ground to the challenging party, by an average of 6.9 points.
The average Democratic ticket lost 8.9 points, reflecting the difficulties of holding together a Progressive party for more than two terms, especially (as in 1920, 1952, and 1968) when international crises commit Democratic administrations to overseas military adventures, alienating the party’s dovish wing. Ten of the 11 also lost ground in the overall popular vote, the exception being Herbert Hoover following Calvin Coolidge in 1928 (more on that election later; for now, it’s sufficient to note there was a significant third-party vote in 1924 but not in 1928). The last ten in a row, all since Grant, have dropped at least 4.5 points in the two-party vote—more than enough to give Republicans, as the challenging party, the win in 2016. And Grant had the advantage of running as a de facto opposition candidate: Andrew Johnson, the president the prior three years, had campaigned for the opposing party, the Democrats, in the 1866 midterms and had been impeached and almost removed from office by the Republican-controlled Congress in spring 1868.
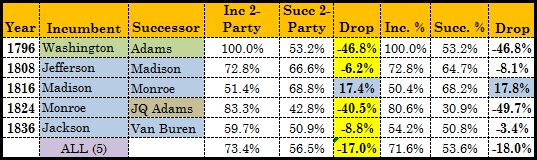
 If you’re wondering, we have national popular-vote figures from just one incumbent re-election in the second two-party system (1828-1852), and it follows the same pattern: Andrew Jackson in 1832 won 59.2 percent of the two-party vote (54.2 percent overall), which dropped to 50.9 percent for his vice president, Martin Van Buren, in 1836 (Van Buren got 50.8 percent overall; 58.1 percent if you compare only to the main Whig candidate, William Henry Harrison, but while the Whigs ran three candidates, they had only one Whig on the ballot in each state, in a bizarre strategy that has never been repeated to throw the election into the House). The data we have before that is less useful, as many fewer states chose electors by popular vote before 1824, two of the four incumbent re-elections in that era (George Washington in 1792 and James Monroe in 1820) were effectively uncontested, and the “two-party” vote is a bit of a misnomer for what happened when the Democrat-Republicans broke up in 1824, as Jackson and John Quincy Adams each claimed to represent the same party. Still, even in early America, the only election to buck the historic trend was the rebound from James Madison’s relatively close wartime re-election in 1812 to Monroe’s 1816 victory over a Federalist Party in its death throes after opposing that war and threatening secession:
 Returning to the post-1856 era, what of the other five elections that followed an incumbent re-election, but that sought to extend the streak with another incumbent on the ballot? Four of those five (including FDR’s third and fourth terms, in which the same candidate was back on the ballot) won re-election, but again, four out of five lost ground in the two-party vote, two of them (FDR in 1940 and Ford in 1976) by significant margins. The one exception is Teddy Roosevelt, who had three full years in office to chart a different course than his predecessor in 1904, rebranding his party as a trust-busting champion of the little guy after five years of William McKinley’s more traditionally business-friendly conservatism. If you include these five elections, the average dropoff is still 5.7 points, and the average Democratic dropoff is 6.5.
 We’ve been looking so far at percentages, but in understanding how and why these shifts in the general electorate happen, it’s important to bear in mind that the electorate is not static. New voters register, and voters who didn’t vote before show up at the polls, while others die or stay home. In the past, these shifts could be even more dramatic due to a faster-growing population, changes in voter eligibility rules and practices for women, young voters, and African-Americans, and the admission of new states. But even today, the electorate remains a moving target that defies mechanistic analysis, all the more so given the steady downward drift in the percentage of registered or eligible voters who vote. Looking at the data since 1980, consider how the eligible non-voting population stacks up to the votes actually cast for the various candidates:
 Here, divided into two charts, we see the shifts in turnout in these 16 elections (contrasted with the turnout shift in the prior re-election) and the shifts in the total number of votes for the incumbent and challenging parties:
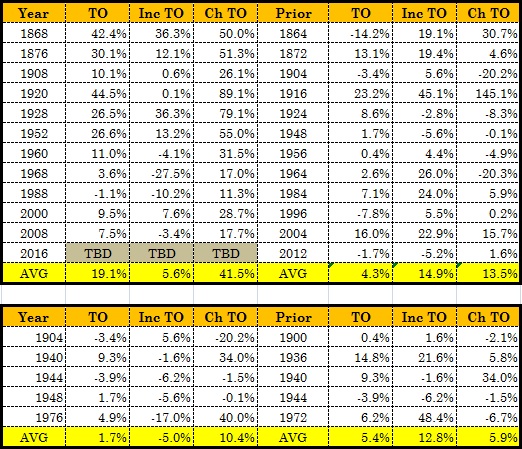 As you can see, elections with incumbents on the ballot tend to see markedly slower growth in the electorate, as a re-election campaign is mostly about voters’ opinions of the same person who was on the ballot four years earlier. In the 11 elections with no incumbent, turnout was up an (unweighted) average of 19.1 percent, compared to 4.3 percent in the preceding election. Some of that is skewed by unusual cases: the electorate effectively doubled in 1920 when women got the vote, and the shift from a wartime election to Reconstruction and emancipation had a big impact on the electorate in 1868. But we still see this dynamic at work, in part due to the closeness of the elections—the electorate grew rapidly in 2000 after contracting in 1996, and grew in 1960 (albeit, with two new states) after being stagnant in 1956. And in the bulk of these races, the total vote for the challenger party grew about twice as fast as the electorate, indicating (roughly) that the challenger party was getting about half its growth from new voters and half from converts (either converts from the incumbent party or from third parties).
Let’s just pause here and note the remarkable political achievement, which we seem to have erased from our collective memories, of George W. Bush increasing the total vote for the Republican ticket by more than 20 percent two elections in a row, from 39 million votes in 1996 (with Ross Perot still on the ballot, although weaker than in 1992), to 50 million in 2000, to 62 million in 2004. FDR in 1932 and 1936 is the only other post-1856 candidate to grow his party’s vote total by 20 percent in consecutive elections behind the same candidate (the Democrats matched this in 1960 and 1964 behind JFK and LBJ, and had also grown over 20 percent in 1928 behind Al Smith; the Republicans, recovering from the party split of 1912 and with the help of women’s suffrage, did the same behind Charles Evans Hughes in 1916 and Warren Harding in 1920).
I mention Bush (and could mention that Democrats grew their total vote over 15 percent behind John Kerry in 2004 and Obama in 2008, before contracting by 5 percent in 2012) because it’s important to remember that even today, a candidate for the challenger party can change the dynamics. Al Gore actually drew 7.6 percent more votes than Bill Clinton had in 1996, but saw Clinton’s large edge over Bob Dole evaporate. In other elections, like 1968 and 1988, the challenger party was more directly growing at the expense of a declining incumbent party. While each election tells a different story, they all support the common theme that the years after an incumbent’s re-election are fertile ground for growing the opposition faster than the incumbent can keep up, as its coalition either fractures or fails to win new converts beyond its base.
Battlegrounds: Lose Nationally, Lose Locally
This is all well and good, you may say, but the national popular vote isn’t really all that important (as Al Gore could tell you); elections are won in the states, and don’t the Democrats have an advantage in the Electoral College?
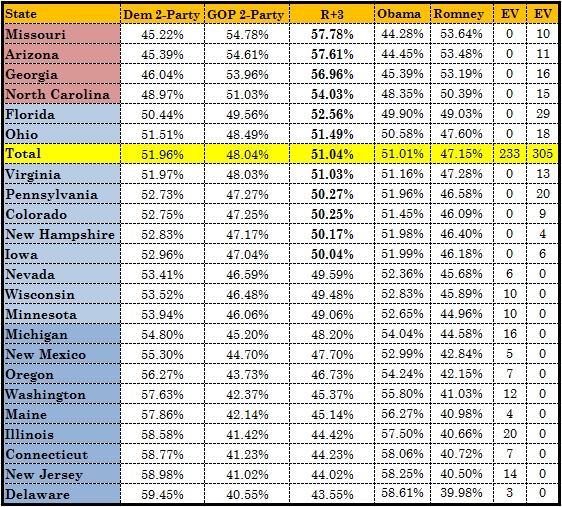
The short answer is yes, based on the 2012 map, they do. Obama in 2012 won two states, Florida and Ohio, by less than his margin in the national popular vote, and flipping those two states alone only gets Republicans to 253 electoral votes. If you add Virginia, the only other state Obama won with less than 52 percent of the two-party vote, Republicans are still four electoral votes short, needing to flip one of Colorado, Pennsylvania, New Hampshire, or Iowa, all states where Mitt Romney got less than 47 percent of the popular vote and less than 48 percent of the two-party vote. Thus, if you simply slide the 2012 results by two points in the two-party vote, the Democrats win again. On the other hand, if you add three points to the GOP share of the two-party vote, suddenly the Republican candidate has over 300 electoral votes:
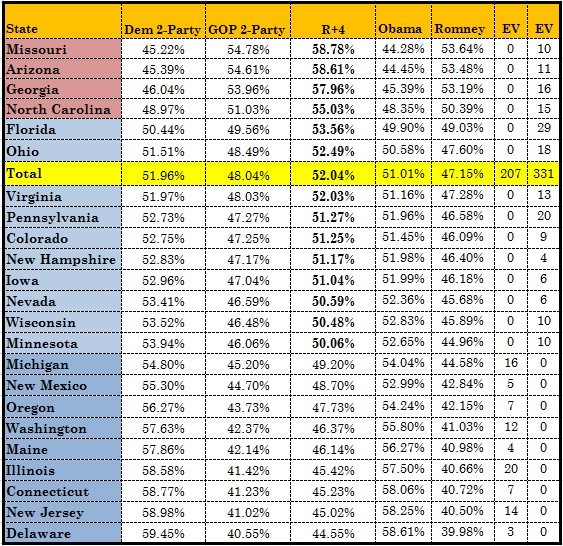
 And if the two-party vote moves four points in the GOP direction across the board, you get 331 electoral votes in the Republican column, a margin of victory on par with Obama’s showing in 2012:
 How realistic is that? Well, history tells us that the popular vote shift in the direction of the challenger party is not likely to be uniform across all states—but it also tells us that a shift of three, four, or more points in the battleground states is surprisingly common.
To measure how common it was to flip a contested state by three, four, or more points, I went back over the 11 elections at issue, as well as looking more broadly (to incorporate the five elections with an incumbent on the ballot) and more narrowly (at the six post-World War II elections with no incumbent on the ballot). For each election, I isolated the “battleground” states in two ways. First, looking prospectively from the prior election, I included every state in which the incumbent won at least 45 percent but less than 60 percent of the two-party vote. Second, looking retrospectively to identify battleground states that didn’t look like battlegrounds four years earlier, I included states outside that range that flipped to or from the incumbent party in the Electoral College. I did not include states that flipped between the challenger party and a third party, unless they met the other criteria, although those were rare.
While I ignored “faithless elector” cases, in two cases, I included states that flipped only partially in the Electoral College—Nebraska in 2008 (where Obama won one congressional district’s separate electoral vote, hence, a flip of 0.2 states) and Maryland in 1908 (Maryland put the names of the electors on the ballot beginning in 1904, and while Republicans won a majority of the popular vote in both years, they somehow took only one of the state’s seven electors in 1904 and two in 1908, hence, a reverse flip of 0.14 states).
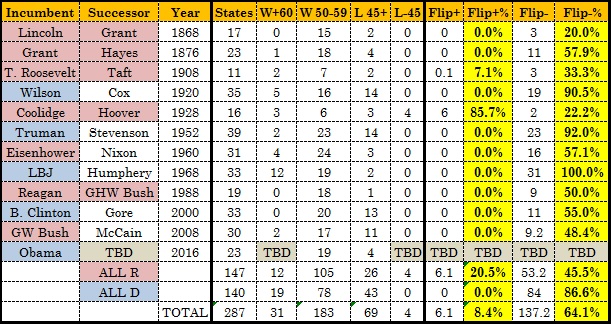
This gives us a sample of 287 battleground states: 214 won by the incumbent in the prior election, including 31 won with 60 percent or more of the two-party vote; and 73 lost by the incumbent in the prior election, including four lost with less than 45 percent of the two-party vote (all of them in the 1928 election).
Out of that sample, nearly two-thirds of the battlegrounds flipped to the challenger party in the next election—137.2 of 214 (64.1 percent). Of the 73 lost by the incumbent party in the prior election, only 6.1 (8.4 percent) were flipped to the incumbent party in the next election, six states in 1928 and the aforementioned one Maryland elector in 1908. And when the Democrats are the incumbent party, the numbers are even worse: 84 out of 97 battlegrounds (86.6 percent) flipped to the Republican challengers. Here are the results in chart form:
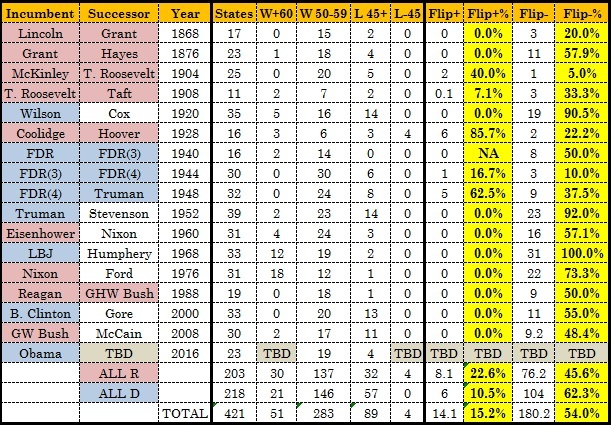
 If we expand our view to include all 16 elections, we grow our sample to 421 battleground states: 334 won by the incumbent in the prior election, including 51 won with 60 percent or more of the two-party vote; and 93 lost by the incumbent in the prior election, including the same 4 lost with less than 45 percent of the two-party vote in 1928.
Out of that sample, still almost half of the battlegrounds flipped to the challenger party in the next election—180.2 of 334 (54 percent). Of the 93 lost by the incumbent party in the prior election, only 14.1 (15.2 percent) were flipped to the incumbent party in the next election. When the Democrats are the incumbent party, even with FDR on the ballot in two of the seven elections, the numbers are again worse: 104 out of 167 battlegrounds (62.3 percent) flipped to the Republican challengers, only six of 57 (10.5 percent) back to the incumbent Democrats:
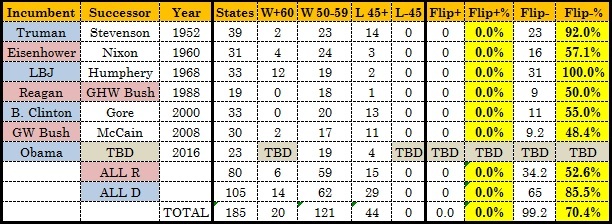
 In the six non-incumbent post-re-election elections since World War II, all but one of which were lost by the incumbent party, the results are most dramatic of all (and would be even more dramatic if we included 1976). These six races offer us 185 battleground states: 141 won by the incumbent in the prior election, including 20 won with 60 percent or more of the two-party vote; and 44 lost by the incumbent in the prior election with at least 45 percent of the two-party vote.
Out of this sample, 70.4 percent of the battlegrounds flipped to the challenger party in the next election (99.2 of 141) and not a single battleground state lost by the incumbent party was recovered in the next election, although Hubert Humphery’s Southern strategy in 1968 did help Georgia flip from Barry Goldwater to third-party Dixiecrat candidate George Wallace. When the Democrats were the incumbent party, the proportion of battleground states flipped to the Republican challengers grows to 85.5 percent (65 of 76):
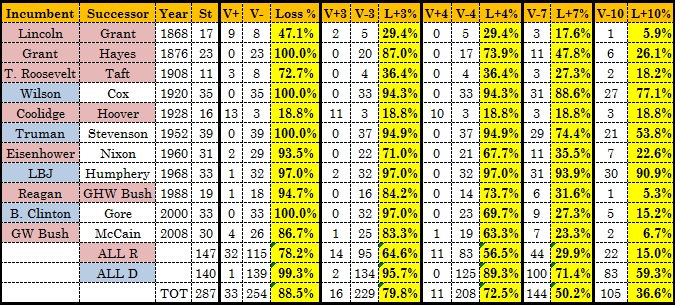
 So, that’s how the battlegrounds ended up. But returning to our original question, how far did they have to move to get there? I also looked at the shift in the two-party vote on a battleground state by battleground state level. Starting with our original sample of 287 battleground states across 11 elections from 1868 to 2008, we find that:
The incumbent party’s share of the two-party vote declined in 254 of 287 (88.5 percent) of the battleground states, by three or more points in 229 states (79.8 percent), by four or more in 208 states (72.5 percent), by seven or more in 144 states (50.2 percent) and by 10 or more in 105 states (36.6 percent). The incumbent party improved by four or more points in only 11 states, 10 of them in one election (1928). And Democrats running as the incumbent party fared the worst, losing vote share in 139 out of 140 (99.5 percent) of the battleground states, declining in 134 of those states (94.5 percent) by three or more points, 125 states (89.3 percent) by four or more, 100 states (71.4 percent) by seven or more, and 83 states (59.3 percent) by 10 or more:
 As before, if we widen our inquiry to add the six post-re-election races with an incumbent on the ballot, the numbers get slightly more favorable for the incumbent party, but still quite grim. In these races, we have 421 battleground states across 16 elections, a fairly robust sample by any standard, and the incumbent party remains at a decided disadvantage:
The incumbent party’s share of the two-party vote declined in 347 of 421 (82.4 percent) of the battleground states, by three or more points in 286 states (67.9 percent), by four or more in 257 states (61 percent), by seven or more in 177 states (42 percent) and by 10 or more in 129 states (30.6 percent). The incumbent party improved by three or more points in 41 states (9.7percent), by four or more in 31 states (7.4 percent), and 26 of them in two elections (1904 and 1928). And yet again, Democrats running as the incumbent party fared the worst, including losing vote share in 197 out of 218 (90.4 percent) of the battleground states, fully half of those (109 states) by seven or more points:
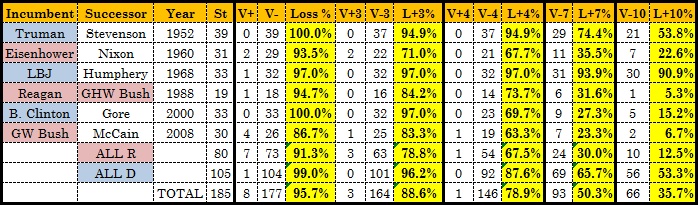
 This trend is by no means ancient history, and if anything has accelerated in recent years. The 1976 election stands out as one of the worst wipeouts, with the incumbent Republican Party losing vote share by at least three points in all 31 battleground states, by four in 29 of them, by seven in 24 and by 10 in 19. But even excluding 1976 because there was an incumbent on the ballot, they paint a grisly picture:
The incumbent party lost ground in the two-party vote in 177 of 185 (95.7 percent) of the battleground states, 164 of those (88.6 percent) by three or more points, 146 (78.9 percent) by four or more, half of the battleground states—93 (50.3 percent)—by seven or more points, and 66 (35.7 percent) by 10 or more points. The most dramatic of these is Texas in 1952 flipping to Eisenhower after Truman had won 73 percent of the two-party vote four years earlier. Shifts of significant size are not just possible in these elections, they’re the norm. And once again, the Democrats had the worst of it—non-incumbent Democrats running as the incumbent party since 1952 have dropped at least three points in the two-party vote in 101 out of 105 battleground states (96.2 percent):
 By contrast, the only battleground state in this period to move four points in favor of the party in power was Arkansas in 2008. Here, in fact, is the complete list of the eight states since 1952 (even if you include 1976) where the incumbent party managed to gain rather than losing share of the two-party vote:
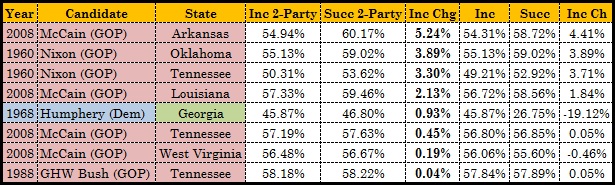 This is not an encouraging list, especially since (1) one of the states on the list, Georgia in 1968, involved a 19-point dropoff in the Democrats’ absolute share of the vote, just a smaller dropoff than the Republicans sustained from Goldwater to Nixon; (2) three of the eight states were the same party running in the same state (Republicans in Tennessee), and (3) two of the eight may have been driven by the Catholic John F. Kennedy faring poorly due to his religion, and four involved Obama doing badly in Southern or Appalachian states where (due to a variety of factors quite likely including his race as well as the hangover in Arkansas from his primary battle against the Clintons) he was uniquely poorly suited to run.
Measuring The Battlefield: Parallels and Precedents
The numbers above should be sobering for anyone who views the 2012 map as set in concrete. That said, how competitive is the current map? Including the races with incumbents, eight of the last nine elections have featured 30 or more battleground states, although in two of those cases (1968 and 1976) those battlegrounds only developed retrospectively, with the challenger party flipping 12 states in 1968 and 18 in 1976 that had been won with at least 60 percent of the two-party vote just four years earlier. So, what looks like a stable map can change dramatically – although since 1976, only one such state has flipped (Indiana in 2008), plus that one district in Nebraska. By contrast, in the 2000 and 2008 elections, there were a lot of battlegrounds on the board that the incumbent party had lost the last time around.
As of now, the Democrats will inherit 23 battleground states, 19 of them won by Obama. That is a comparable prospective battleground map to 1968 (22 battlegrounds, 20 won by LBJ) and 1988 (19 battlegrounds, 18 won by Reagan), although each of those was in the aftermath of a legitimate landslide. But consider the more optimistic of those two parallels, George H.W. Bush’s win in 1988, the likely model for a Hillary Clinton campaign that may be long on resume and symbolic and social wedge issues and short on substance. As poor an opponent as Michael Dukakis was, the incumbent Republican Party still lost ground by three points or more in 16 of the 19 battlegrounds, by four or more in 14 of the 19, and saw Dukakis flip half of the 18 battleground states won by Reagan. Reagan had won almost 60 percent of the two-party vote; his successor had a margin for error. Hillary, or whoever the Democratic nominee is in 2016, will not, and would lose the election with losses of ground similar to Bush’s in 1988. (You can review the state-by-state results for each of the elections discussed here in the forthcoming companion piece).
Going further back over the state-by-state results, the one exception, in which the incumbent party’s national popular vote losses were distributed across the map in a way that worked significantly to its advantage, was 1928, and that was due in large part to the strategic choices of the challenger party—not because the challenger party failed to reach out beyond its base, but because it alienated its base in pursuit of a new one that wasn’t ready to pay electoral dividends.
The Democrats in 1920 had concluded the Progressive presidency of Woodrow Wilson by absorbing the largest margin of popular-vote defeat in American history—and at the hands of Warren G. Harding, no less. Four years later, the success of the conservative Calvin Coolidge left them unable to compete on economic or foreign policy, so they retreated to their geographic base’s resentments. The 1924 Democratic Convention at Madison Square Garden became popularly known as the “Klanbake” due to the heavy Klu Klux Klan presence and influence (complete with a cross-burning). The Democrats’ nominee was John W. Davis, who would later go on to represent the losing side in Brown v. Board of Education, with William Jennings Bryan’s brother as his running mate. Sen. Robert LaFollette ran as the Progressive Party candidate, raising the banner of the movement that had dominated American politics as recently as eight years earlier; he carried only his home state of Wisconsin, and the Democrats got 28.8 percent of the popular vote and didn’t win a single state outside the South.
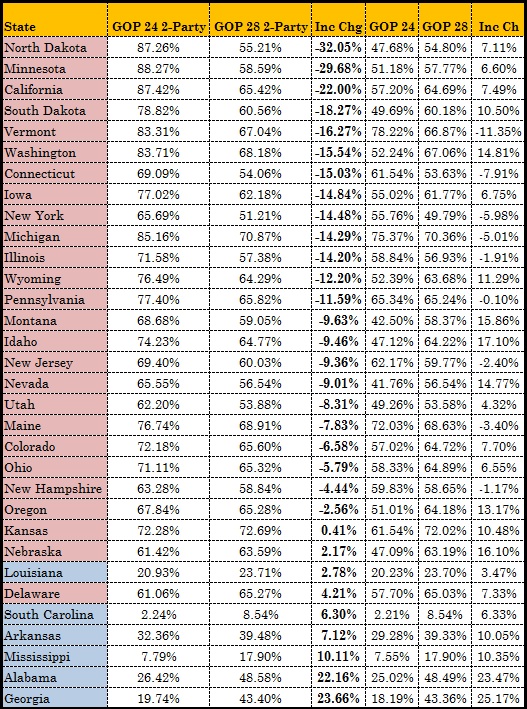
In 1928, recognizing that this was a dead end, the Democrats tried something completely different and nominated Al Smith, the liberal Governor of New York and the first Catholic nominee of a major party. While the Smith nomination would pay dividends four years later, considered strictly from a short-term Electoral College perspective, it was a complete fiasco. Smith’s Catholicism and opposition to prohibition alienated the remaining Democratic base, flipping Texas, Florida, Virginia, Oklahoma, North Carolina, and Tennessee into the Republican column while flipping only the nation’s two most Catholic states (Rhode Island and Massachusetts) to the Democrats. While Herbert Hoover’s share of the two-party vote dropped 6.4 points from Coolidge’s, he lost ground in only three battleground states, and the other (Wisconsin) flipped from LaFollette to Hoover:
 Smith’s big gains were all rolled up in states Coolidge had dominated with anywhere from 65 to 88 percent of the two-party vote (partly because Smith was bringing back the LaFollette voters, who made up 16.6 percent of the electorate, and partly because he was bringing a lot of recent immigrants to the polls):
 As a parallel for 2016, this does not offer much hope to the Democrats. It’s conceivable that Republicans could choose a nominee who brings in a lot of new voters while alienating a big chunk of their base—Rand Paul might excite a lot of libertarians while losing many national-security hawks and law-and-order voters, Brian Sandoval could win over Hispanic voters while alienating pro-lifers—but a Paul nomination is not all that likely, and Sandoval shows no sign of running. It’s more likely that the 2016 Republican nominee will be someone acceptable to Republican primary voters. That doesn’t leave much in the way of hopeful examples for the Democrats to emulate.
Can The Democrats Buck History?
Of course, historical rules are made to be broken, and there is never a guarantee that it won’t be different this time. Before 2012, no presidential candidate since Carter in 1976 had built a winning coalition while losing voters over 30 or losing Independents by five points. Many other aspects of Obama’s youth-heavy, non-white-heavy coalition were historically unusual. Before 2012, no president in the post-1856, two-party era had won a second term with fewer popular votes or a smaller percentage of the popular vote than in his first election; only Wilson in 1916 had won with fewer electoral votes, and only Wilson and Lincoln in 1864 (both originally elected in three- or four-way races) had won with a smaller percentage of the two-party vote. Obama’s coalition shrank in all four categories (fewer electoral votes, fewer total votes, and a smaller percentage of the total and two-party votes), yet he won anyway. But of course, by defying history and winning re-election with a smaller coalition than he started with, he leaves his successor with the task of hanging onto a narrow margin.
The common Democratic rejoinder at this point is demographic: basically, that all the history set forth above is predominantly the history of white voters, and non-white voters will be more loyal to the party in power. This is a dubious proposition: even in 2012, over half of all Obama’s voters were white, and voters who may not be inclined to switch parties can always stay home. And it is very much unproven whether Hispanic and Asian voters will simply vote blindly for Democrats in perpetuity; Asians were still a Republican bloc until the mid-1990s, and as recently as 2004, Hispanic voters pulled the lever for George W. Bush in much larger numbers than they did for Mitt Romney in 2012. Polling continues to show a substantial number of Hispanic voters who have voted for a Republican at some point in their lives and may be open to doing so again. That is not to say Republicans will face no challenges in wooing such voters, only that it would be foolhardy to assume they are immune to the dynamics that have driven voters of all stripes to turn away from the incumbent party in past elections.
A lot more can happen in two years, and history is never destiny. But the history of American elections following the re-election of an incumbent strongly suggests that the Democrats face a much more significant challenge in retaining the White House in 2016 than the conventional wisdom would have you believe.