A new Gallup poll finds that state governments enjoy widely varying levels of trust.
Other than governors going to prison or a poor economy, why might some state governments be more trusted than others?
Gallup’s findings noted, “In general, trust is lower in more populous states than in less populous states… Larger states have larger economies and more citizens needing services, and often more diverse populations, so they may be more challenging to govern than smaller states. The population size-trust relationship may help explain the finding that trust in state government tends to be higher in Republican-leaning states than Democratic-leaning ones, since larger states tend to be Democratic and smaller states Republican.”
By far, Illinois was seen as the least trustworthy of the states with Gallup helpfully observing, “Although Illinois’ exceptionally low trust level does bring down the averages for both Democratic states and most populous states, those groups of states would still rank lower than other states if Illinois were excluded. Illinois’ position at the bottom of the list in residents’ trust in state government is not surprising, given that its last two governors, Rod Blagojevich and George Ryan, were sentenced to jail for crimes committed while in office. Two prior Illinois governors from the 1960s and 1970s also went to jail. Additionally, the Illinois economy remains shaky and the state government continues to struggle to balance the budget, even after a significant income tax increase a few years ago.”
Gallup concludes their survey with this truism, “Trust in government is a key commodity for a democratic government to function well.”
Other than elected officials going jail or running the state into the ground, might there be other factors in play that determine or are related to trust? This question is especially of interest since Texas, the second-most-populous state, has the sixth most-trusted state government while California, the most-populous state, ranks as the sixth-least trustworthy. (Significantly, Gallup’s polling was completed before the conviction of a Democratic California state senator on eight counts of voter fraud and the recent arrest and indictment of two more Democratic state senators for corruption.)
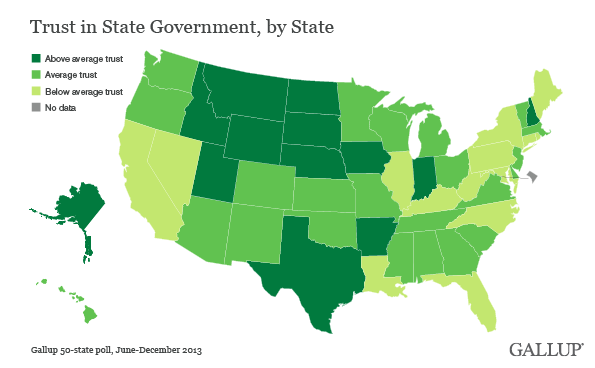
Looking at Gallup’s state government trust map (below) it is difficult to divine any obvious correlations beyond that smaller states tend to be more trusted by their constituents. Neither typical demographic factors, term limits, excise taxes on alcohol or cigarettes, nor religious affiliation appear to be an issue in citizens’ trust of their state government.
If basic differences between the states don’t appear to have any relation to the wide variation in trust, it might be illuminating to test other measurable differences by running a coefficient of determination, or R squared, to see what relationships might exist.
So, for the sake of science and speculation, the following factors were tested to see how they correlated to state trust, understanding that correlation doesn’t prove causation. The factors are listed in increasing level of correlation:
Weak to no correlation to trust
- The percentage of college graduates (more trust with a lower percentage of graduates): 0.0000
- A state’s rate of military volunteering (more trust with more volunteering): 0.0007
- The rate of incarceration in a state (more trust with less incarceration): 0.0079
- The public school teacher to student ratio (more trust with a lower ratio, i.e., more teachers): 0.0245
- The percentage of a state’s minority population (more trust with fewer minorities): 0.0333
- Frequency of church attendance (more trust with more church attendance): 0.0388
- The rate of the population on Temporary Assistance to Needy Families (TANF) (more trust with less welfare): 0.0502
Slight correlation to trust
- The population of the state (more trust with a smaller population): 0.0609
- One year growth in the economy (more trust higher economic growth): 0.0778
- The state’s percentage of foreign born residents (more trust with less foreign born): 0.0787
- The percentage of taxes at the state and local level as a share of income factored with the public school teacher to student ratio (more trust with less taxes and more teachers): 0.0907
- Political donation limits (more trust with greater or no limits): 0.0943
Moderate correlation to trust
- The rate of union membership (more trust with lower membership): 0.1288
- The state’s Soft Tyranny Index (more trust with less Soft Tyranny): 0.1324
- The percentage of taxes at the state and local level as a share of income (more trust with less taxes): 0.1536
- Gun control laws (more trust with less gun control): 0.1606
- Lawsuit climate (more trust with less frivolous lawsuits): 0.2017
- Days legislature in session (more trust with a fewer days the legislature is in session): 0.2246
- Commute time (more trust with shorter commutes): 0.2990
Strong correlation to trust
- Commute time factored with state and local taxes (more trust with shorter commutes and lower taxes): 0.3399
- Commute time factored with state and local taxes and legislative days (more trust with shorter commutes, lower taxes and less time legislature is in session): 0.3564
- Taxes factored with gun rights and lawsuit climate (more trust with lower taxes, stronger 2d Amendment rights, and less frivolous lawsuits): 0.3795
- Commute time factored with taxes, gun rights and lawsuit climate (more trust with shorter commute, lower taxes, stronger 2d Amendment rights, and less frivolous lawsuits): 0.4108
As mentioned, Gallup said in their survey that “In general, trust is lower in more populous states than in less populous states…” but, as noted above, population could only explain about 6 percent of the trust difference between the states. Rather than mere population in a state, certain policies are linked far more strongly to trust, such as, is government perceived as meeting its basic obligations while keeping the tax burden light? Does government respect the rights of its citizens to keep and bear arms? Is state government perceived to be captive to the interests of trial attorneys? That’s why the last combination of factors, commute time, taxes, gun rights and the lawsuit climate can explain about 41 percent of the variation in state trust.
So, kudos to the citizens, lawmakers, governors, and other elected officials of North Dakota, Wyoming, Utah, South Dakota, Nebraska, Texas, Alaska, Montana, Indiana, and Iowa for running the ten most-trusted states. If others want to follow and gain greater citizen trust all they have to do is stop growing the size and scope of government by cutting taxes, trusting their citizens to defend themselves, enacting lawsuit reform and prioritizing roads.
Oh, and not sending any governors or state senators to prison would help too.
The Hon. Chuck DeVore is the Vice President of Policy at the Texas Public Policy Foundation. He served in the California State Assembly from 2004 to 2010. Follow him on Twitter @chuckdevore