Public Policy Polling (PPP), the controversial liberal polling firm based in Raleigh, North Carolina, just released a new poll of its home state. The results? The poll is complete garbage, but not for the typical nitpicky reasons like party splits or demographic weights. No, this poll is terrible for entirely new reasons that call into question the basic competence of the firm’s management team.
The PPP poll of North Carolina, which was released yesterday, purported to analyze the close race for the U.S. Senate seat of Democratic incumbent Kay Hagan. PPP’s poll showed the race to be neck-and-neck, with one GOP challenger beating Hagan by a point and each of the three other GOP challengers within the poll’s margin of error. That’s all well and good and tracks with what one might expect from a state in which Romney narrowly beat Obama in 2012. But a deeper analysis of the poll’s internals suggests the findings are not even close to reliable.
For example, take a look at the favorability ratings of Hagan’s three main GOP challengers, organized by respondents’ ideologies, on pages 7 and 8 of the poll. The main GOP challengers are virtually unknown throughout the state, which is hardly surprising. One is an obstetrician (Brannon), another is a pastor (Harris), and the third is the GOP speaker of the North Carolina House of Representatives (Tillis). The poll’s findings confirm the lack of name ID for the candidates (on average, 65 percent of respondents weren’t sure of their opinions of the candidates), but the breakdown of the favorability numbers by ideology reveals serious problems with the data.
Take a look at the favorable ratings and the “Not Sure” numbers for the GOP candidates among respondents who described themselves as “very liberal.” Notice anything odd?
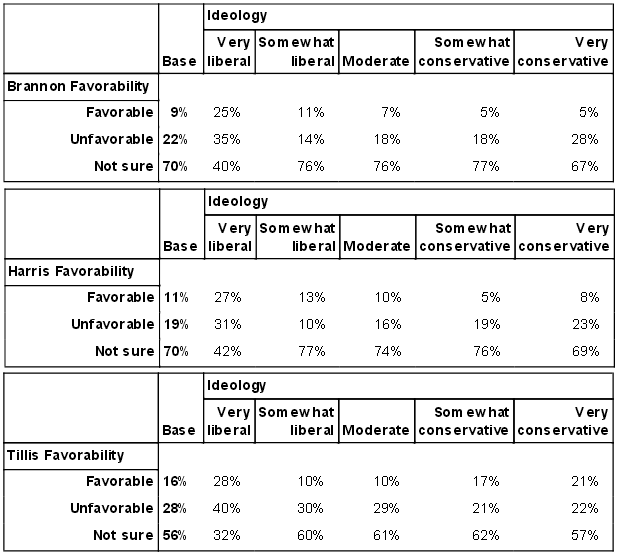
The first thing you should notice is the stark difference in name ID between very liberal voters and everyone else. Only one-third of “very conservative voters” — those most likely to vote in a GOP primary and therefore the most likely to be targeted by the GOP campaigns — expressed an opinion about Greg Brannon, yet 60 percent of very liberal voters had formed an opinion of him. The same dynamic is evident in the numbers for Mark Harris and Thom Tillis. In each case, very liberal respondents were far more likely to have formed an opinion of the candidates than every other ideological group.
The next thing you should notice is that very liberal voters were far more likely than very conservative voters to have a favorable opinion of the GOP challengers. Very liberal voters were five times more likely than very conservative voters to view Brannon favorably. They were more than three times more likely to view Harris favorably. And they were 33 percent more likely to view Tillis favorably.
On average, nearly 27 percent of very liberal voters expressed favorable opinions of the three main GOP challengers, compared to only 11 percent of very conservative voters. On what planet does that come even close to making sense?
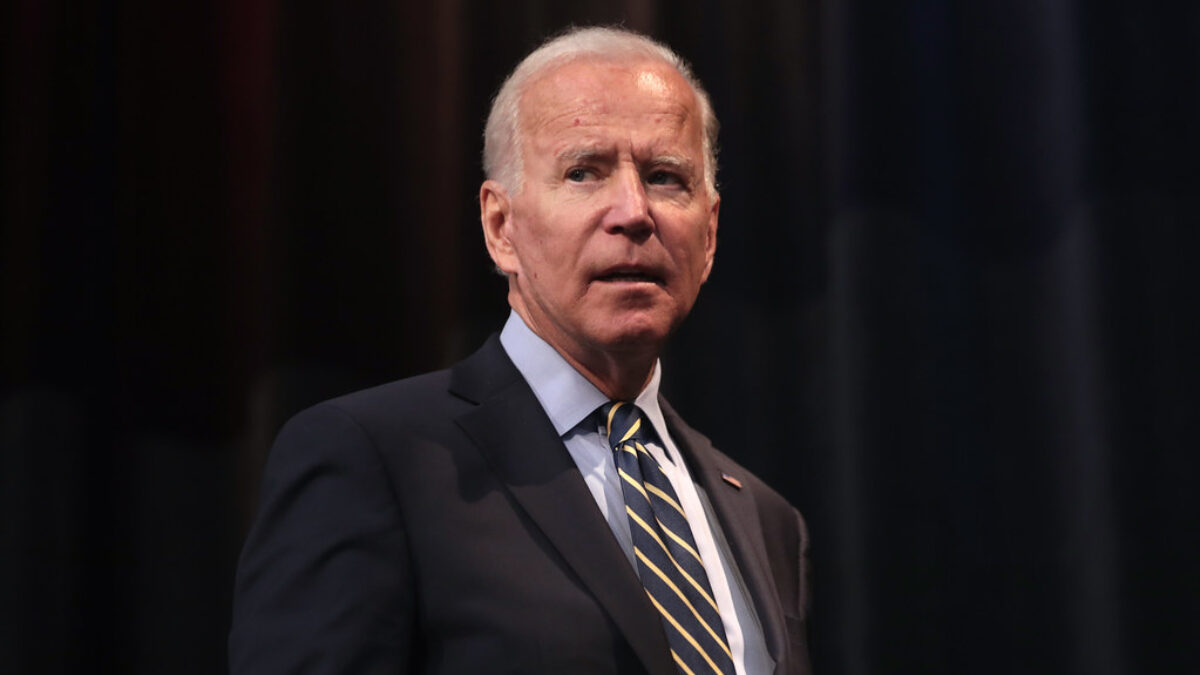
When challenged on Twitter over the blatantly bogus data, PPP director Tom Jensen (pictured above) said, “Looks like there were dozen respondents pressing 1 on every question so they would be favorable toward everyone and very liberal.” Because PPP’s polls are automated, respondents are required to press numbers on their phones to express their opinions. In the case of this poll, a person pressing “all 1’s” would register as a white, Democratic female between the age of 18 and 29. According to Jensen, the “all 1’s” responses would cause people to register approval of every candidate or issue mentioned in the poll, hence the bizarre inclination of very liberal voters to have a more favorable impression than very conservative voters of GOP candidates.
@Nate_Cohn Looks like there were dozen respondents pressing 1 on every question so they would be favorable toward everyone and very liberal
PublicPolicyPolling (@ppppolls) November 12, 2013
Translation: “Our data is irreparably tainted by mindless button pushers, and in no way does that make us question the validity of our results.”
Even more horrifying than the fact that PPP apparently allows such obviously bogus data to remain in its results, however, is that Jensen’s response makes no sense given other data from the poll and data from the 2012 elections. Based on the structure of PPP’s questions, a poll with a disproportionate percentage of mindless “all 1’s” button pushers should’ve uniformly made the electorate look whiter, younger, more female, and more Democratic than in 2012. But that’s not what we see in this PPP poll.
Compared to the 2012 electorate in North Carolina, the PPP sample definitely appears to be whiter (73 percent vs. 70 percent) and more Democratic (D+12 vs. D+6), but that’s where it ends. When compared to 2012, the PPP sample actually has a lower percentage of women (54 percent vs. 56 percent) and a lower percentage of voters ages 18 to 29 (15 percent vs. 16 percent). Neither of those results is consistent with Jensen’s explanation. Furthermore, in the absence of retroactive data manipulation, how exactly does a D+12 electorate, as indicated in PPP’s poll, deliver a 47-47 tie between Barack Obama and Mitt Romney when a D+6 electorate in 2012 delivered a 2-point Romney win?
Of course, basic questions about methodology are nothing new to PPP and Jensen. How, then, should a political junkie or polling analyst treat PPP’s garbage data going forward? Nate Cohn, an analyst for TNR and a long-time PPP skeptic, has a suggestion.
“Treat PPP like a relatively inaccurate pollster,” Cohn writes.
I have a different recommendation: treat PPP like an ultra-liberal PR firm that uses highly questionable “data” to push media narratives favorable to its ultra-liberal clients.


