Twitter raised the stock price target for its upcoming initial public offering (IPO) to $25 per share, according to new documents filed yesterday with the Securities and Exchange Commission (SEC). The company, which plans to sell 70 million shares during its IPO on Thursday, will be worth over $13.6 billion if its stock price hits the upper range of its $23 to $25 per share price target. Twitter now expects its IPO to raise more than $1.6 billion for the company.
All of this begs the question: is Twitter really worth $14 billion?
There are two schools of thought when it comes to stock valuation that can help us answer this question: fundamental value analysis (popularized by people like Benjamin Graham, Warren Buffett, and Seth Klarman) and market psychology (who cares about the company’s financials as long as somebody else will pay a higher price than I did?).
The market psychology method resembles mob psychology more than anything else. Bubbles are usually caused by this dynamic. Rather than focusing on whether a company is generating enough earnings or free cash flow to justify its price, adherents of the mob psychology school of valuation focus on what other people think of the stock. If a company’s stock price is increasing, then it must be a good buy. As long as the music’s still playing, keep on dancing.
This behavior is what inflated the housing bubble that eventually burst in 2006. Instead of treating property like any other cash-producing financial security that hopefully generated enough income to pay the bills — rental revenue minus the myriad costs associated with owning and maintaining a property — investors instead assumed that whatever lofty price they paid today would be even higher tomorrow. Housing prices have always increased in the past, therefore they’ll always increase in the future. Yeah, the price might not make strict financial sense right now, but who cares as long as there’s another sucker who will buy it before your adjustable rate resets or your balloon payment comes due?
Fundamental value analysis, on the other hand, requires investors to look at a company’s financial picture from the bottom up. What are the major revenue and cost drivers for the company? How does the company manage its cash? Are the firm’s resources eaten up by fixed costs (e.g., capital-intensive companies like Ford or Intel), or are its costs almost entirely variable (e.g., tech companies like Google that can scale without massive capital investment)? What does the competitive environment look like?
Most fundamental value disciples focus on free cash flow (FCF), although simple earnings and revenue estimates are helpful when comparing the current price of a company to other companies in the same industry. The rationale behind the focus on FCF is that at the end of the day, cash in the bank is far more important than a line on an income statement. Although a full cash flow model is beyond the scope of this post (and would require a rather large amount of guesswork as to Twitter’s out-year earnings picture), we can at least take a brief look at the company’s financial statements and see what they tell us about the company’s current financial picture.
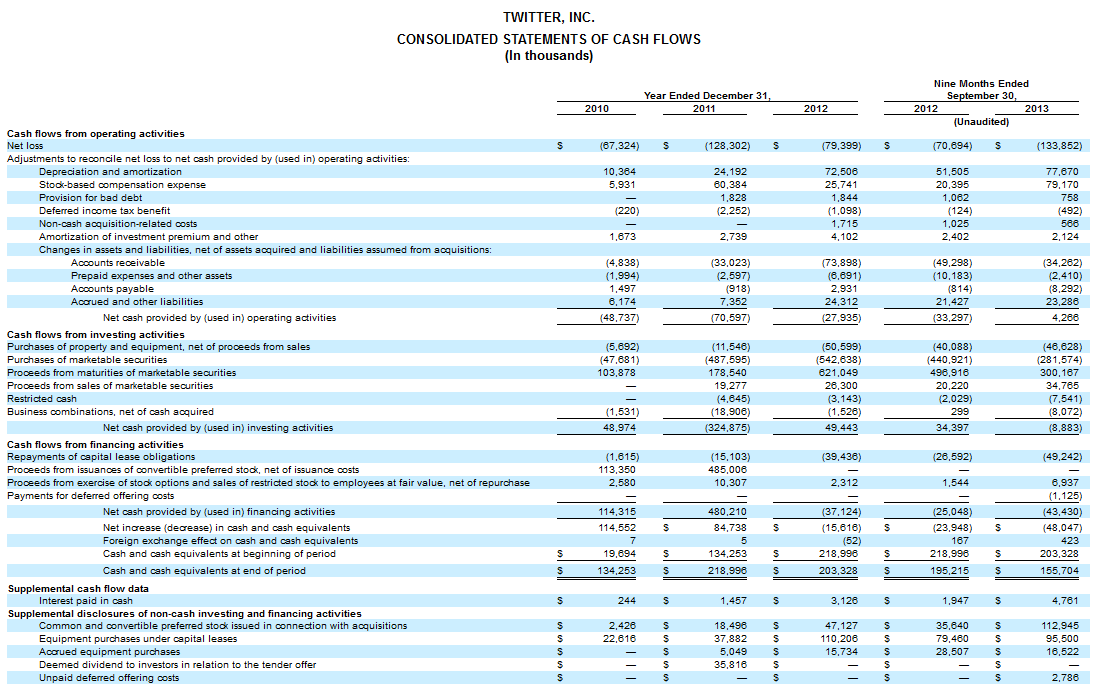
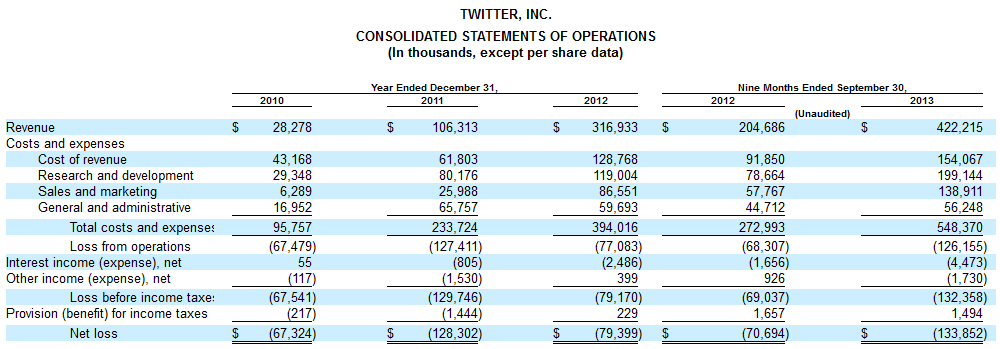
For the first nine months of 2013, Twitter for the first time posted positive cash flows from operations, a key indicator of a company’s well-being (the three major sources and uses of cash are operations — a company’s core activities; investment — the purchase or sale of property or equipment; and financing — payments to creditors/investors and long-term lessors). While Twitter is still burning more cash than it’s generating, due in large part to its investment in IT infrastructure, its core business activities are generating net cash. Whether they’re generating enough cash, even with generous growth assumptions, to warrant an eye-popping $14 billion is highly questionable.
But what about the earnings picture? It is unfortunately much uglier than the cash picture. Throughout its history, Twitter has posted accumulated losses totaling $483 million. It posted losses of $128 million in 2011, $80 million in 2012, and $134 million through the first nine months of 2013 (a loss of more than $1 per share). Long-term losses are not unusual for a start-up company — after all, early-stage investors pour money in with the expectation that the cash will be used to support the company until it can reach sustainable profitability. But all things being equal, a fundamental value investor will have a difficult time placing a $14 billion valuation on a maturing company that is still yet to make a dime.
So how does Twitter’s IPO price compare to recent IPO’s for similar companies? When Google debuted on the market in August of 2004, the company had already been profitable for several years, going back to 2001. In 2003, the year before its IPO, Google produced profits of $106 million on revenues of nearly $1.5 billion. In just the first six months of 2004, it posted profits of $143 million on revenues of nearly $1.4 billion. And not only was the company generating significant cash flows from operations ($370 million through June 30, 2004), the entire company had been generating significant free cash flow since 2002.
At the end of its first trading day, Google shares were trading at over $100 per share, putting its price-to-earnings ratio, or P/E, in the neighborhood of 80. The P/E ratio — a firm’s stock price divided by its previous or forecast earnings — is a standard measure used to compare valuations across companies and help investors to determine if companies are relatively undervalued or overvalued. Google’s market capitalization following its IPO — the entire value of the company’s outstanding shares based on its stock price — was roughly $27 billion. The company currently trades at a P/E of 30.
But what about Facebook, a social media giant that is probably a better comparison for Twitter than Google? When Facebook IPO’d in May of 2012, it had also posted several years of profitability. The company first hit the black in 2009, with profits of $229 million on revenues of $777 million. Like Google, Facebook’s operating activities were generating a ton of cash. Facebook’s P/E at the end of its first day of trading was around 100.
With no profits and no free cash flow to speak of, can Twitter possibly be worth upwards of 50 percent of Google’s market cap at the end of its first trading day? Whereas Twitter has posted accumulated losses approaching half a billion dollars, Google had already banked over $330 million in accumulated profits by the time it went public. Google’s operations were generating hundreds of millions of dollars in cash each year by the time the company completed its IPO. In contrast, Twitter’s operating activities produced $4.2 million through the first nine months of 2013.
For Twitter’s IPO P/E to match Google’s, it would need to be on track to produce $175 million in profits for the year. To match Facebook’s P/E, it would need $140 million in profits. Instead, it posted $134 million in annual losses through September 30, 2013.
Which brings us back to the original question: is Twitter really worth $14 billion? Based on a fundamental analysis of the company’s underlying financials and a comparison to recent similar tech IPOs, the answer seems to be a resounding “No.” Is it an impressive company with an amazing global reach? Absolutely. Could it post stunning growth numbers and blow its forecasts out of the water? Maybe. But Twitter’s numbers as of today do not appear to come anywhere close to justifying the sky-high valuation the company expects to see when the stock begins trading on Thursday.
So how could Twitter possibly fetch its expected valuation of $14 billion if it is so obviously overpriced relative to recent tech IPOs?
Easy. The mob rules.