The year is 1986. It’s the sixth year of the president’s term in office, and that generally spells trouble. Between 1900 and 1974, the average loss for the party in power in the White House following an incumbent re-election had been 39 House seats and five Senate seats; between 1874 and 1958, the average loss in the sixth year of a president’s term had been 60 House seats and eight Senate seats. And Republicans were defending a bunch of Senate seats they won narrowly in the landslide general election of 1980, except without President Reagan (and Jimmy Carter) on the ballot.
But there were also reasons to be optimistic. Reagan, after winning a historic 49-state re-election landslide in 1984, had managed to become even more popular: a Gallup poll just before the 1986 election showed his approval rating at 63 percent approval and 29 percent disapproval. And the landscape of contested Senate races, much as in 2014, was dominated by Southern, Rocky Mountain, and Great Plains states—not states that are naturally liberal turf. Seven Senate races (six on Election Day, plus a special election in June) and one Governor’s race were decided that year by less than two points, five of them involving incumbent Republican senators. And in those eight races, Democrats went eight for eight, plus winning a rematch of the special election by 3.6 points in November. (Counting that rematch, Democrats went 4-3 in Senate races decided by 3-6 points, but 4-8 in governor’s races decided by that margin, all but one of them open seats).
With six out of eight embattled Republican incumbents losing (in North Dakota, South Dakota, Colorado, Alabama, Georgia, North Carolina, and Washington), the GOP’s Senate majority went up in smoke, even though Republican Senate candidates actually earned a larger share of the two-party vote nationwide than they had in 1980.
Ever since 1986—and maybe going back further, to the 1960 presidential election—Republicans have gone into the home stretch of every election consumed with anxiety about their party’s ability to close the deal and win the close ones. Sometimes, that manifests itself as fear of voter fraud. In 1986, for example, memories were still fresh of the notorious 1982 Illinois governor’s race (decided by 0.14 points after the Republican candidate had led by 15 points in the polls), in which a federal investigation that resulted in 63 convictions found that at least 100,000 fraudulent votes had been cast in Chicago alone, some 10 percent of the city’s entire vote.
Sometimes, the concern is about Democrats’ election-turnout gimmickry, like the Bruce Springsteen concert for John Kerry that drew 80,000 people to vote early in Madison, Wisconsin in 2004 (Kerry won Wisconsin by 11,384 votes, 0.38 percent of the vote) or a series of Katy Perry shows to rally early voters in 2012. Sometimes, it’s concern about the superior organization and manpower of organized labor. Sometimes, most famously in 2012, it’s concern about the deficiencies of the GOP’s get-out-the-vote operations and the Democrats’ superior use of data-mining and community-organizing tactics.
Whatever the reasons, the lingering fear in GOP circles is that Republican campaigns will find a way to lose a lot more close ones than they win. Does the data from recent elections support that fear, or is it an urban legend?
The Data on Statewide Elections Say
To get a sense of the answer, I took a look at all the statewide Senate and governor’s races from 1998 through 2013 (thanks to Sean Trende of RealClearPolitics for a big assist with the data) as well as all the statewide results in the presidential elections during that period. Let’s begin with the very closest races, those decided by less than one percentage point. There have been 27 such races since 1998, and Democrats have won 20 out of 27:
 That’s a truly impressive showing, and proof of how very unusual George W. Bush’s victory in Florida in 2000 was. For whatever reason, when statewide races are decided by less than 1 point, Democrats win almost three-quarters of the time. When the margin opens to 1-2 points, that advantage dissipates, and the Democrats win only half the races:
 The same is true for elections decided by 2-4 points; out of 50 such races, Democrats won 25. But when we expand the definition of “close” races to races decided by 4-6 points, the Democrats’ edge pops up again, winning 30 out of 46. Overall, out of 147 races decided by 6 points or less, Democrats won 88, or 60 percent.
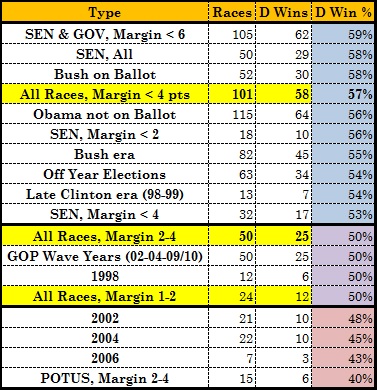
The divide by the margin of victory is the starkest, but if we group these races, do we see any other patterns, such as Democrats doing better in close general elections than close off-year elections, or better with Barack Obama on the ballot? Here are the groups of races in which Democrats did best:
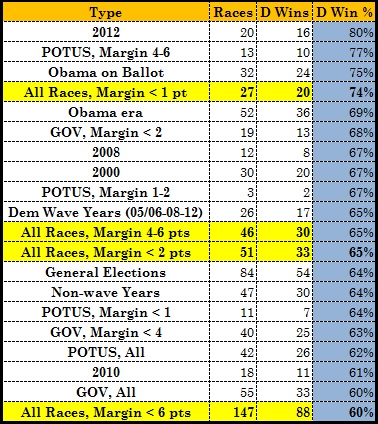 There’s a certain amount of overlap between the categories here, but clearly the 2008 and 2012 elections were especially good for Democrats in very tight races. But even when Obama is not on the ballot, the Democrats over the past five years have done exceptionally well in the most competitive elections. They’ve done slightly better in tight presidential than governor’s races, and slightly better in governor’s than Senate races. Where have they been less dominant? In general, the Democrats had less success in the 1998-2006 period than in the “Obama era,” which I classify as starting in 2008, and the various ways of dicing the data just reinforce that:
 What does all this tell us? Retrospectively, of course, it tells us that the Democrats have had a significant competitive advantage in the very closest of elections, and in close elections overall, over the past 16 years, and that that advantage has grown during the Obama years. Certainly from the institutional perspective of the GOP, it should tell the party establishment they are not getting the job done in the races where the value of political operations (voter mobilization and turnout, ballot access and ballot integrity, recount litigation) is most urgent.
As with any historical analysis, there may be limits to what this tells us as a predictive matter. These are not especially large sample sizes of races, and even if the trends are real, they may not be due to factors that can be replicated. If the surge in wins in close races is mostly just statistical noise, it may be that a regression to the mean is in order, in which Republicans begin again claiming their share of close elections—just as the winners of close Senate elections in 1980 had to pay the piper in 1986. We have seen in the past at the presidential level that parties that win a lot of states by narrow margins in an incumbent’s re-election campaign have trouble holding onto them in the next election.
In either event, both parties already have their machinery in place for the 2014 election, and Republican Party chairman Reince Priebus is talking a good game about restoring GOP operations to competitive parity. If the 2014 cycle yet again provides fresh examples of Democrats dominating the very closest races, Republicans will need to take a harder look at how they are doing it.