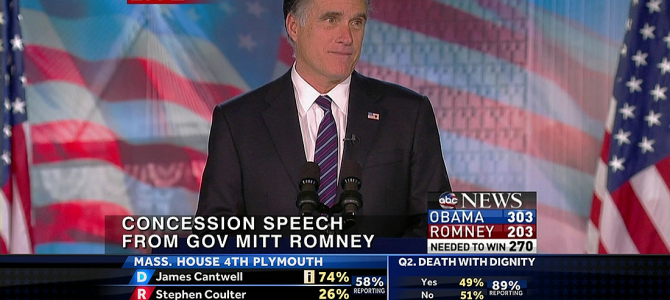
Rather than doubling down on the “just get to 270” strategy that’s been utilized by the GOP since 2000, the Republican Party must expand the map if it ever wishes to win another presidential election. Instead of just hoping that Virginia will magically turn red again, the GOP needs to focus on other traditionally Democratic states that have nonetheless moved rightward since 2000.
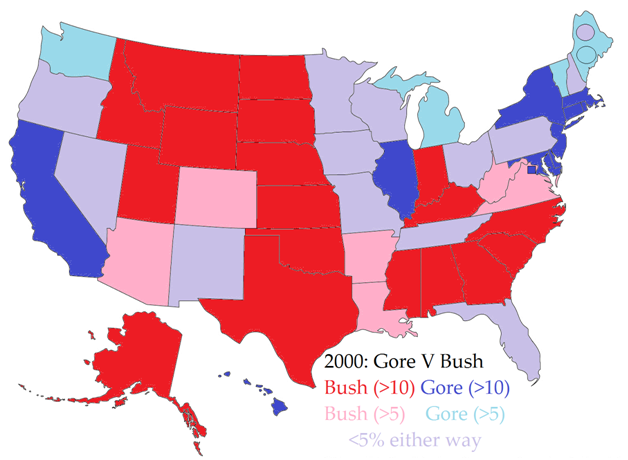
Using the year 2000 as a baseline, since it was the most recent closely contested race with near-even get-out-the-vote operations between the parties, I wanted to see how the close and swing states (anything decided by a margin of fewer than 10 points) have drifted since then. I started with just the raw margins of these states in 2000, scaled on their +R margin of victory.
The next map takes the contested states shown above (i.e., those that are not solid red or solid blue) and then scales them based on their relationship to the overall popular vote. A redder/pinker state gave Bush a larger margin than he received nationally, while a bluer state gave Gore a larger margin than he received nationally (purple states roughly mirrored the national popular vote). As the map shows, the middle third of the nation was an electoral hot zone, the West Coast wasn’t yet monolithically blue (nor was the Northeast), and a handful of southern states were surprisingly competitive.
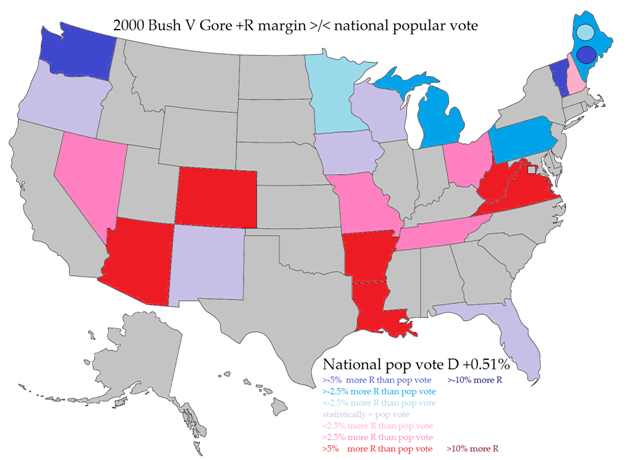
The 2000 election provided a prime opportunity for either party to rack up over 300 electoral votes. Hundreds of electoral votes were just a few points to the left or right of the final Bush-Gore national split. Bush, the eventual winner of the electoral college vote, came within roughly 75,000 votes of winning Oregon, New Mexico, Wisconsin, Iowa, and Minnesota. Imagine going back to an electoral map that purple.
The next map, which shows the results of the 2012 election, has given plenty of Republicans heartburn.
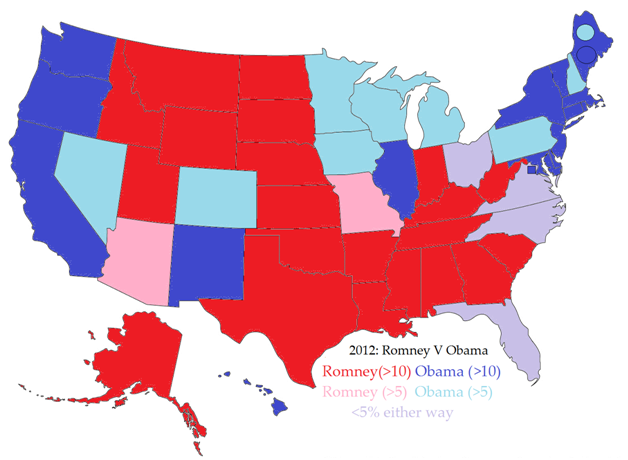
Taken strictly red-blue, it shows Romney getting trounced by over a hundred votes in the electoral college. If you take all of the states that went to Obama by fewer than five points and hand them to Romney, he would have still lost the election with only 266 electoral votes to Obama’s 272. Colorado, Pennsylvania, Iowa, and New Hampshire were each won by Obama by a margin of just over 5 percent.
But let’s look at this map the same way we looked at the 2000 map. How did these states break compared to President Obama’s popular vote margin of just under 4 percent?
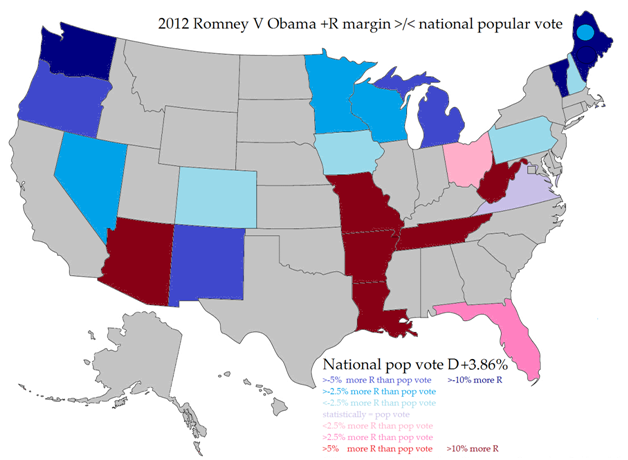
Pennsylvania only slightly outperformed the national popular vote margin for Obama, Virginia nearly mirrored the national margin, and despite ultimately voting for Obama, both Ohio and Florida still leaned more Republican than the country as a whole. The natural reaction to this when planning ahead is to double-down on the “just get to 270” strategy by forcing Ohio and Florida back into the Republican column and then bringing Virginia back into the fold. This “OHFLaVA” strategy would bring the hypothetical Republican candidate within 4 electoral votes of winning, meaning he or she would just need to win one additional state to win the White House.
But here’s the rub: unless you analyze how each of these states has shifted over time, you’ll be throwing good money after bad and chasing states that have deliberately decided to shift hard to the left in favor of Democratic candidates. Without looking at how states have shifted relative to the national popular vote, there’s also the tendency to incorrectly assume that some states — like those that were barely lost by the GOP in 2000, yet drifted out of reach in 2012 — are no longer worth the effort.
Put another way: if a state voted for Gore by 3 but Obama by 6, the immediate thought is, “Dang, we lost another one.” But what if that state initially went to Gore by 2.5 points over his national win but delivered an even smaller margin of victory to Obama 12 years later? Despite the loss, that state would have actually drifted rightwards, not leftwards, compared to the country as a whole. Those states deserve the biggest efforts going forward, with voter contacts, registration drives, and advertisements designed to capitalize on the trend and eventually turn those states red.
There are also a number of states that have brought the GOP a great deal of frustration by turning against it. If the shift away from Republicans is small — say no more than 3.5 points — a serious counter-attack in these states could very well pay off and bring them back into striking distance, requiring additional investments and attention from the Democratic candidate, or the efforts could successfully push the states into the Republican column.
However, shifting those states closer and closer to the Republican Party will require a great deal of money, time, and effort — resources the party can’t afford to waste on states that have taken a clear left turn since 2000. Flipping a state that has been tantalizingly close is unquestionably a smart move. But trying to flip a state that teases us while continuing to run further away (e.g., a state the GOP won by 8 percent in 2000 but lost by around four percent in 2012) is no more effective than throwing money into an abyss. “Close” can be misleading, and the continued pursuit of such mirages will be electorally catastrophic, allowing potential “gets” to lose interest and drift away.
A Different Strategy
So what’s my proposal? I say we stop burning enormous amounts of money in Virginia, Nevada, and Colorado, and instead invest it in Pennsylvania, Florida, and the Midwestern states of Ohio, Minnesota, Wisconsin, Michigan and Iowa, with a goal of winning at least 300 electoral votes.
Shocked? Can’t understand how it’s a good idea to cut out the Old Dominion when it had voted for Bush by comfortable margins less than a decade ago? Wondering why I’d favor Michigan over Nevada when it went to Obama by a larger margin? And what’s so magical about 300?
The next map shows why.
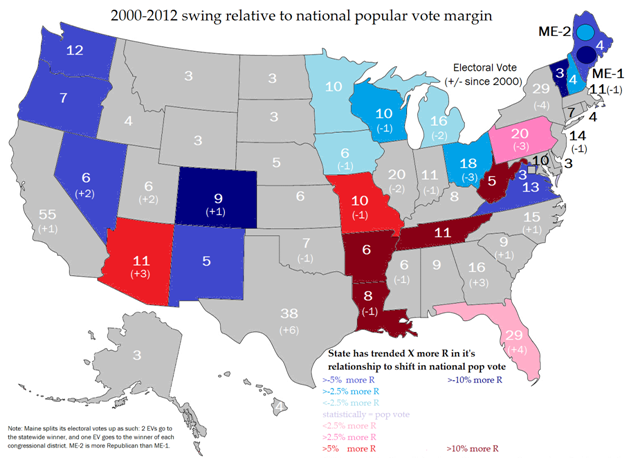
There are only two states on this map that voted for President Obama and still bucked the national trend and became redder: Florida, which everybody agrees is a wise investment, and Pennsylvania, which many deride as the GOP’s new White Whale. Well that White Whale has nearly the same number of votes as Colorado and Virginia combined but received a mere fraction of those states’ combined Republican attention in 2012. Stop this nonsense and feed the red beast within.
As for the Midwestern states, they’ve all remained incredibly close to each other in their margins and in their general trend: away from the GOP, but at less than a third of the drift of Virginia, Colorado, and Nevada. Minnesota bucked the 2008 Republican collapse that sent Wisconsin and Michigan into Obama’s column by double digits. Wisconsin and Michigan swung back to within single digits in 2012. Iowa’s R-D registration balance has re-approached parity, and having a concentration of targets within the same region makes for more efficient and effective campaigning.
Ohio’s drift has remained relatively small: its 2000 favoritism for the GOP relative to the national vote remains (see map 4 above) despite the overall trend towards the Democrats. Campaigning there between a stop in Oakland County in Michigan and Allegheny County in Pennsylvania is a no-brainer.
Looking at how the rest of the states trended, we have to ask ourselves: what if? What if we had spent serious money and effort (matching what we were attempting in, say, Colorado and Virginia) in the upper Midwest? Maybe Republicans would have still lost these states, but maybe not. The margins, however, would almost certainly be smaller, setting the GOP up for its next wave of efforts.
We have seen a Democratic turn across the nation since 2000, but it hasn’t been monolithic in its intensity. Once Republicans acknowledge what the electoral map really looks like, it may actually win another national election. I’m not advocating that the GOP completely abandon its old friends. Pump money and personnel into Colorado Springs and Virginia Beach. Pay for ads in Las Vegas. Don’t completely give up on these states, but acknowledge reality and don’t keep counting on the same smaller states trending away to be the party’s “over 270.” Shift the emphasis toward larger states the party has neglected at its own expense.
Setting an electoral vote goal of 300 discourages the electoral atrophy Republicans have suffered from since 2008. Going for big, vote-rich states is no easy task. Republicans will still need to keep an eye on North Carolina, which wasn’t even a swing state in 2000 but went blue in 2008 and nearly repeated the feat in 2012. But by setting a larger baseline goal, Republicans have far more paths to win the 270 votes needed to win back the White House. Using that strategy, the party can still win if a state or two doesn’t fall into place. Most importantly, the strategy will finally help to reverse that undeniable blue trend shown on the final map above.
It’s long past time for the GOP to realize Virginia’s just not that into it, and to finally ask Pennsylvania out on a date.
Brandon Finnigan has been covering polls and elections at the blog Ace of Spades HQ and on Twitter at @conartcritic since 2010. Between races, he shares his love of art, astronomy, and craft beer with his wife in Southern California.


