Plenty has been written already about the failures of the 2014 polls. Nate Silver has run the numbers and concluded not only that the polls were skewed to overstate the performance of Democrats, but that it was, on average, tied with 2002 as the second-worst polling year for Senate races since 1990 (the worst was 1998). I’ve looked back at my pre-election analysis and how it matched the final results, examined the impact of the absence of exit polls in states where they weren’t conducted in 2012, and offered some lessons about what we can learn in the future.
But we should also devote some name-and-shame attention to which polls and pollsters got things particularly wrong—as well as which ones nailed it. I’ve been through all 639 Senate polls listed on RealClearPolitics (RCP), and I present the best and worst Senate polls of 2014.
The Two-Party Vote and Three-Way Races
Polls can tell us a variety of useful information: whom the pollster expects to turn out and vote, what proportion of the electorate appears to still be undecided, what share of the vote is going to third-party candidates. All of these can be interesting and informative, although we were reminded yet again in 2014 that polls tend to overestimate the vote of minor third-party candidates, either because disgruntled voters end up siding with one of the two major parties after venting to a pollster, or because people who actually support the Libertarian or Green or whatever party candidate know their vote is going nowhere and don’t bother voting. If you look at 2014’s third-party candidates, you can see a pretty clear split in two groups:
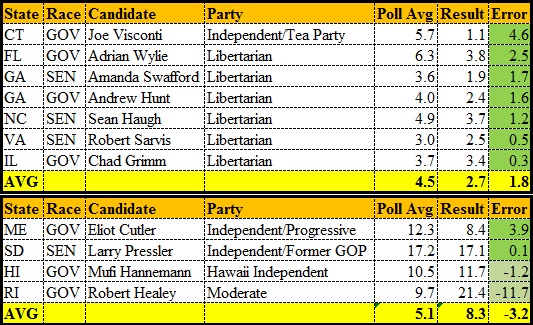 The first group, consisting mainly of Libertarian candidates and polling between 3 to 7 percent, all significantly underperformed the polls, often getting less than half of their polling support. This was in line with the longstanding trend of polls overrating minor third-party candidates.
The second group were third-party candidates who polled in or around double digits, and with a critical mass of voters behind them they did better. Larry Pressler was a former senator from South Dakota as a Republican; Eliot Cutler had run in the Maine governor’s race in 2010; Mufi Hannemann had challenged Neil Abercrombie in the Hawaii Democratic primary in 2010 and served as mayor of Honolulu; Robert Healey had won 39 percent of the vote as the “Cool Moose Party” candidate for lieutenant governor of Rhode Island in 2010, and in 2014 ran on the Moderate Party ticket, which ran a serious third-party campaign in 2010 and is building something like a real third party in Rhode Island (a state whose previous governor, Lincoln Chaffee, was first elected as an Independent).
The impact of third-party candidates on their races may not be what you think. The Robert Sarvis voters in Virginia seem to be hardcore Libertarian Party voters who would have stayed home otherwise (as they did in 2013); the exit polls in Maine found that Paul LePage would have won even without Cutler in the race; and polls seemed to suggest that the pro-Obamacare Libertarian in North Carolina, Sean Haugh, drew the bulk of his support away from Kay Hagan, not Thom Tillis. On the other hand, “Indepdendent” candidates Bill Walker in the Alaska governor’s race and Greg Orman in the Kansas Senate race each ended up running as the de facto Democratic candidate in a traditional two-party race, with Walker winning and Orman losing. Exit polls in South Dakota found that Pressler got the votes of 22 percent of self-identified Democrats but just 9 percent of the votes of self-identified Republicans.
Anyway, the one thing consumers of polls most want to know is the relative standing of the two major party contenders, so for that reason as well as methodological simplicity (given the wide variance in the number of undecideds across polls and the questionable nature of how many undecideds actually end up voting), for each of the 639 Senate polls I simply computed the two major-party contenders’ share of the two-party vote in the poll to the share of the two-party vote they won on Election Day.
Second, I split up the polls into time periods. It’s obviously unfair to compare a late-October poll to a January poll, since a lot of the inaccuracy of early polls can simply be due to intervening events in the race. That said, far too many efforts at grading polls and poll analysts just focus on the closing weeks of the campaign and ignore what pollsters put out for months or even years before the election, polls that can influence coverage and fundraising, and that lots of people rely on. So, it’s worth grading those polls as well, just not side-by-side with the later polls.
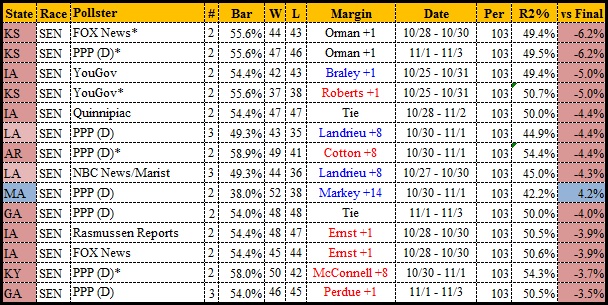
With that said, starting with the earliest polls and working our way forward, let’s hand out the awards. For each poll, I list the pollster, the date it was in the field (I grouped them by the last day), how many candidates were in the poll, and subtract the “Bar” (the final election result) from the Republican candidate’s share of the two-party vote in the poll. Polls that underestimated the Republican are thus marked as negative and in red, polls that overestimated the Republican are marked as positive and in blue. In polls of Louisiana’s “jungle primary,” that’s Bill Cassidy’s share of the Landrieu-Cassidy vote; in Kansas it’s Pat Roberts’ share of the Roberts-Orman vote. “Per” is my code for the time period of the poll.
The Pre-2014 Senate Polls
Let’s start with the 37 polls conducted in 2013 and one poll (a Public Policy Polling, or PPP, poll of the Kentucky Senate race) taken in 2012. These polls would naturally tend not to be that accurate, given how early they were taken. Seventeen of these polls—nearly half of them—were taken by a single pollster, PPP, and several others by partisan pollsters. Here’s the worst early polls:
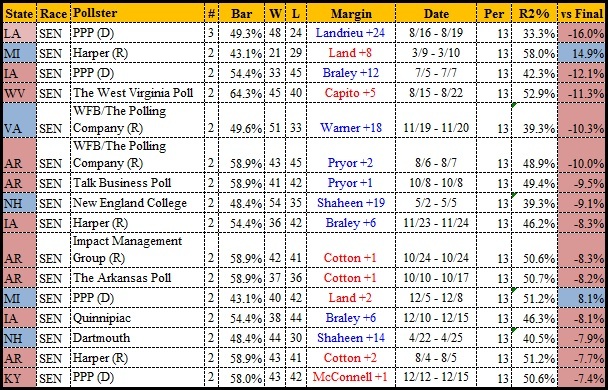 With the exception of the two Michigan polls, every one of these polls overestimated the Democrats, and out on its lonesome, PPP takes two of the top three slots. Silver recently broke down the tendency of pollsters in this race to “herd” and follow the results of other pollsters down the stretch run, and found that PPP in particular tended to do this; Silver noted that “PPP polls can deviate wildly from the actual results when they have few other polls to anchor themselves to.” We will see a number of examples of that, and it’s a particular hazard of being the first pollster in a race. That said, it’s also an occupational hazard of early polling that things will go very differently a year hence, and when we look at the very best polls of 2012-13, we also see a lot of PPP polls that nailed it, mainly though not entirely in blue-state races that ended up never becoming competitive:
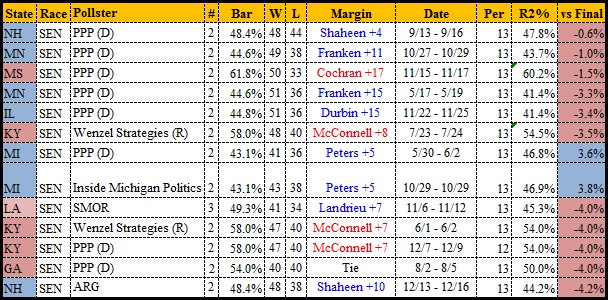 What’s interesting here is that PPP’s New Hampshire poll was actually fairly bad news for Shaheen at the time, but the race went full circle with her opening a big lead thereafter and ending up back where it started. Also, PPP’s 2012 poll of the Kentucky race ended up being a lot more accurate than many polls in that race published a lot closer to the election.
January-April 2014 Senate Polls
The first four months of 2014 saw Senate races starting to take shape, but many still had primary elections to resolve. We have 67 Senate polls in this period. Fifteen of the 67 missed the final result by ten points or more, 12 of those by underestimating the Republican:
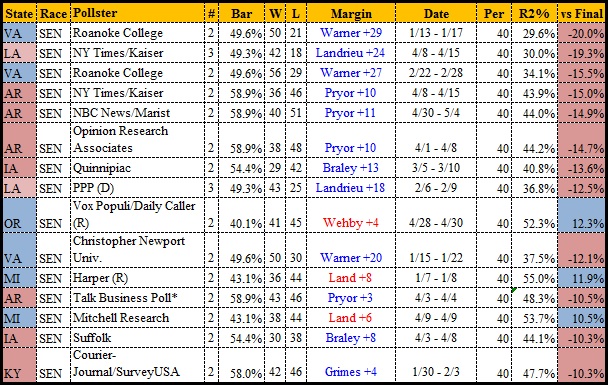 Virginia, Arkansas, and Louisiana, all states with relatively entrenched incumbents but deep voter dissatisfaction with President Obama, all feature prominently here; Roanoke College’s early polls offered no clue how much trouble Mark Warner was in for on Election Night. And polls from Harper, Mitchell, and Vox Populi showing Terri Lynn Land and Monica Wehby ahead were wildly overoptimistic. By contrast, 18 polls in this period got within three points of the pin:
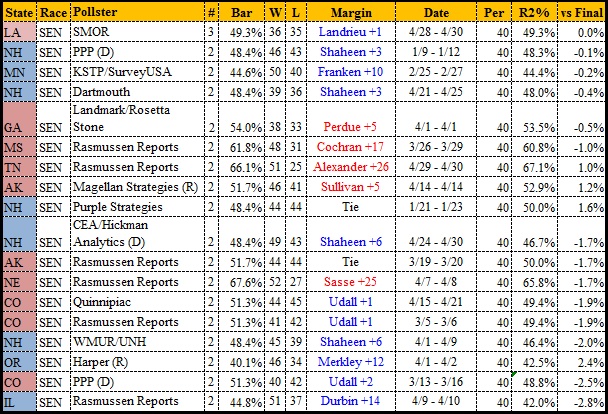 Lots of New Hampshire polls here, and interestingly enough, six Rasmussen Reports polls.
May-June 2014 Senate Polls
Most of the states with hotly contested Senate primaries resolved them in May or June, so we are starting to look more at races that would resemble the later campaign. We have 50 polls in this period. Fifteen of them ended up off by at least six points, 14 of those underestimating Republicans:
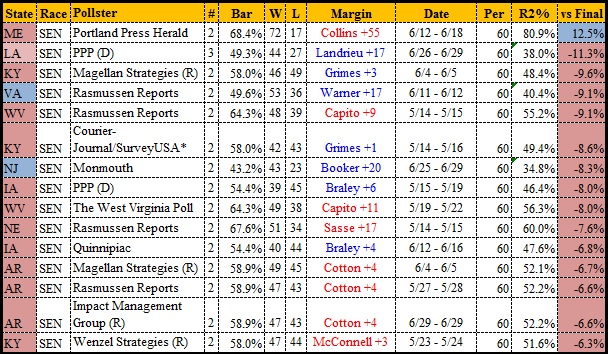 PPP shows up again with the worst poll from any of the actually contested races, but Rasmussen has more than its share of entries, and ironically a couple of Republican pollsters here underestimate how well Republicans would do. Some of this, undoubtedly, is due to polling registered rather than likely voters in the spring. But 14 polls came two points or less from the final outcome:
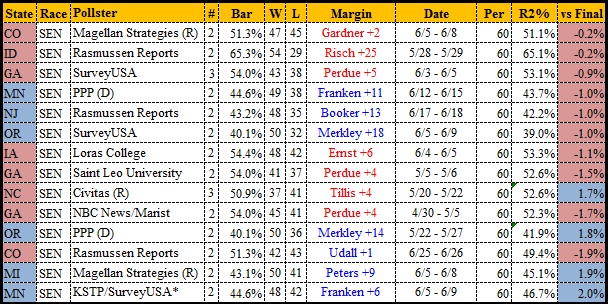 Many of these—the PPP poll of Oregon, the Magellan poll of Colorado—may have seemed unduly aggressive at the time, but ended up on target.
July 2014 Senate Polls
The polls started coming faster in the summer, with 56 polls in July alone, partly because the prolific YouGov polls started entering the Senate races. Twenty of the 56 July polls were at least five points off the mark, 19 of the 20 by underestimating Republicans:
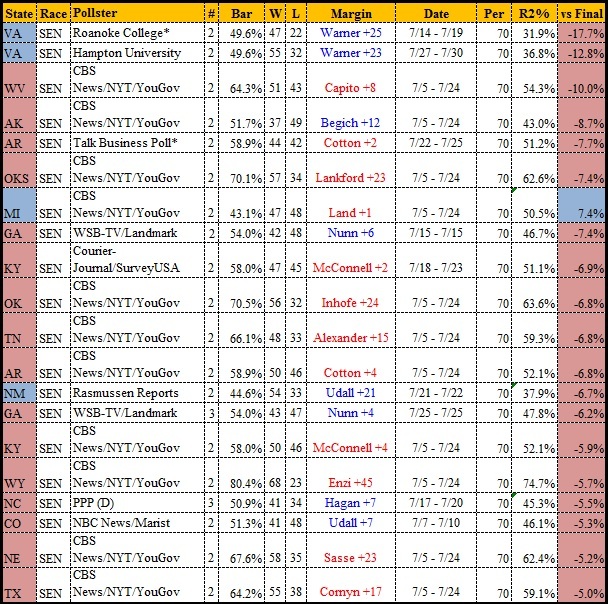 There’s that Roanoke College poll of Virginia again, still blissfully unaware of Mark Warner’s danger. More than half of the worst polls of July (11 of 20) were YouGov polls (just wait until we get to the governor’s races). YouGov had Mark Begich up by double digits; he lost. And PPP, which had a terrible record polling its home state of North Carolina in the 2010 Senate race, was here and for the rest of the race out in front of delivering good news for Kay Hagan.
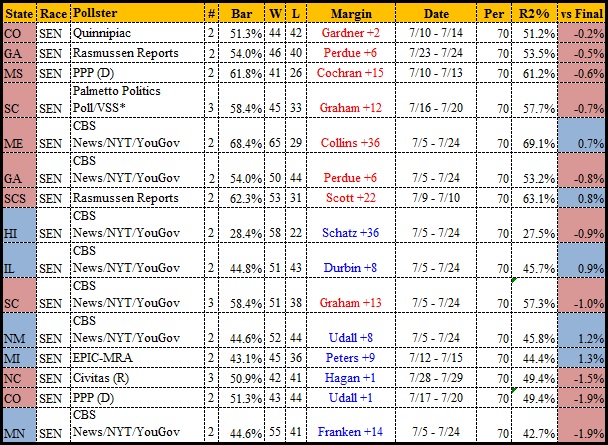 Fifteen July polls got within two points of the mark, including seven YouGov polls, and the bulk of the good polls were in uncompetitive races. But Quinnipiac in Colorado and Rasmussen in Georgia were dead on target, and PPP in Colorado and Civitas in North Carolina both picked up on those being neck-and-neck races.
August 2014 Senate Polls
People vacation in August, and pollsters recognize the difficulty of conducting good polls and getting them covered then. We have only 36 Senate polls for the month, and some high-profile races (i.e., Colorado) didn’t get polled at all (nobody polled Louisiana for two solid months). Twelve of these polls—a third of them—were off by five points or more, nine of those underestimating the Republican:
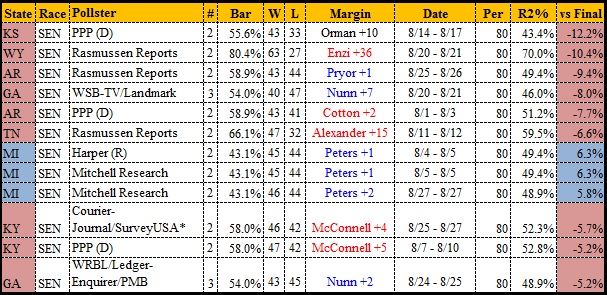 The big bombshell here was the PPP poll released August 19 showing Roberts trailing Orman by 10 points in a head to head race, while he was up four points in a head-to-head matchup with Democrat Chad Taylor. This was the single most influential poll of the 2014 cycle (we’ll get to the No. 2 poll later): it drove huge news coverage and led directly to Taylor being talked into dropping out of the race on September 3 in favor of Orman, whose campaign was staffed and financed by Democrats.
PPP’s August Kansas poll wasn’t necessarily wrong in the sense that it mislaid public opinion at that instant; Orman was an unknown quantity of indeterminate party affiliation, and he would continue to poll close to Roberts throughout the race, although at diminishing levels as he got more exposure. But it was wrong in a fundamental way about the race: Roberts ended up winning 53-43, in all likelihood no better a showing by Orman than Taylor would have made in a head-to-head race. It’s unknowable what would have happened had the three-way race continued; probably Roberts survives, maybe Orman flies better under the radar and wins a divided field, maybe Roberts puts it away a lot earlier without the angst that dogged his campaign to the end. The relevant point to remember going forward is that PPP succeeded in upending a Senate race with a poll that bore no resemblance to what the voters ended up doing.
And not for the first time: in 2012, PPP rushed out a poll after Todd Akin’s now-infamous rape comments purporting to show that Akin was still one point ahead of Claire McCaskill and that a majority of voters wanted him to stay in the race (that poll had an unusually Republican sample); another PPP poll nine days later had McCaskill up just one. Polls the same week by Rasmussen and Post-Dispatch/Mason-Dixon showed McCaskill, who had trailed by three and five points respectively in their most recent polls (and 11 in a SurveyUSA poll) jumping out to a nine- to ten-point lead (she would win by 15). The Akin camp seized on the PPP poll, the only new polling available at the time, as a basis for staying in the race through the August 21 deadline for dropping out without court approval. Shortly after the final September 25 deadline for Akin to drop out under any circumstances passed, PPP released a poll with a more balanced sample showing McCaskill up six.
We should also not let August pass without note of the WSB/Landmark poll that had Michelle Nunn up by seven. Remember that as we look at the 12 August polls that were within two points or less of the final result:
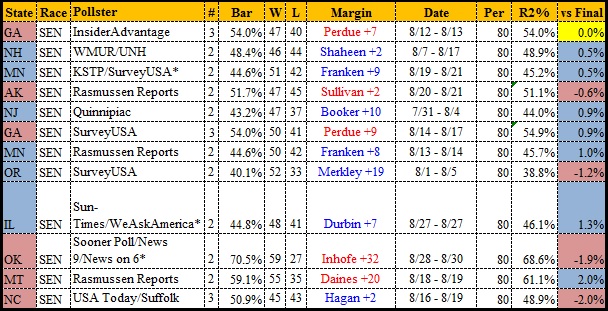 Six of those polls were in races the Democrats ultimately won, but two, Insider Advantage and SurveyUSA, nailed the final result in Georgia. SUSA took a lot of heat for some of the odd internals in its Georgia polls, but it was onto the topline result pretty consistently.
September 1-14 Senate Polls
Starting in September, there’s enough polls and enough movement in the races to use shorter time frames. There were 73 Senate polls concluded in the first 14 days of September, twice as many polls as in the whole month of August. The polls were starting to get better: 19 polls were still at least five points off the final result, and the bulk of those were in the field in the last half of August and the very beginning of the month. Sixteen of the 19 underestimated Republicans; six of the 19 were YouGov polls, plus we again see a PPP Kansas poll and a Virginia poll, this one from Christopher Newport University. American Insights had Kay Hagan up by 10, and YouGov had the last poll showing Terri Lynn Land ahead in Michigan.
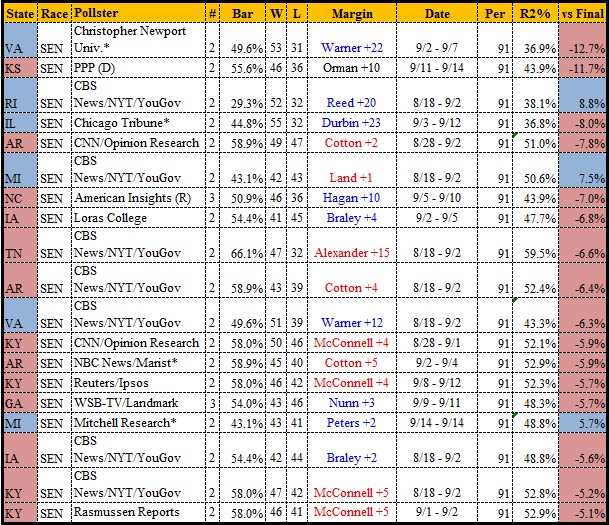 At the other end of the scales, 12 early September polls were 1.1 points or less off the final results, and nine of the 12 were YouGov polls:
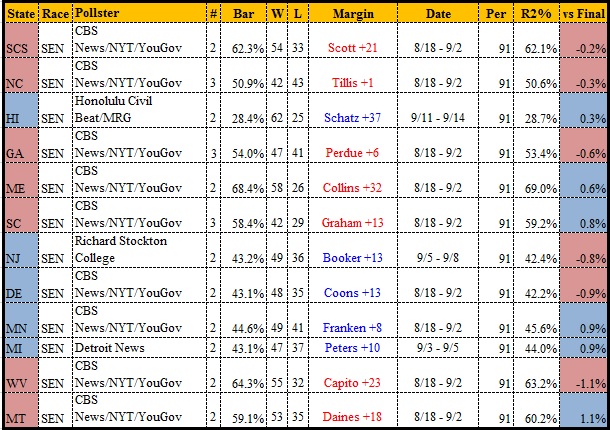 Notably, only two of these (YouGov polls that had David Perdue and Thom Tillis up by close to their margins of victory) were in closely contested races, although the Detroit News had Gary Peters pulling away in Michigan before some other pollsters caught up.
September 15-30 Senate Polls
There were 59 polls completed in the second half of September (fewer polls than in the first half of the month in large part due to YouGov still polling only once a month). We still see 19 polls off by four or more points (16 of them underestimating Republicans), 11 polls off by five or more, three Orman-leading Kansas polls off by eight or more, and two polls still double digits off an election to be held less than six weeks later.
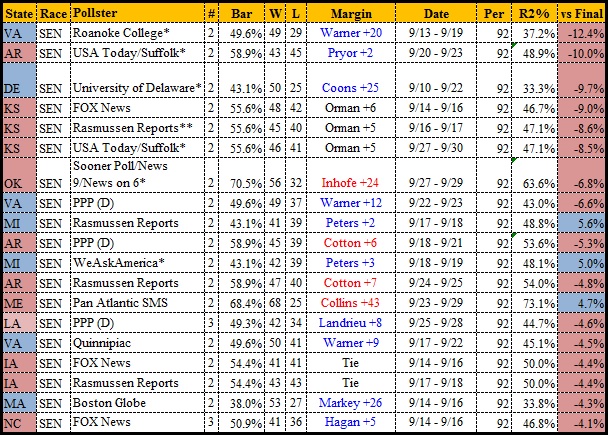 Roanoke College’s Virginia poll still had Mark Warner cruising, although it’s hard in retrospect to know whether the dynamics of the race had started to shift yet; certainly nobody reading the public polls would have guessed. But the USA Today/Suffolk poll with Mark Pryor leading a race he’d go on to lose by 17 points looks pretty hard to defend, and Suffolk had one of the duds in Kansas as well.
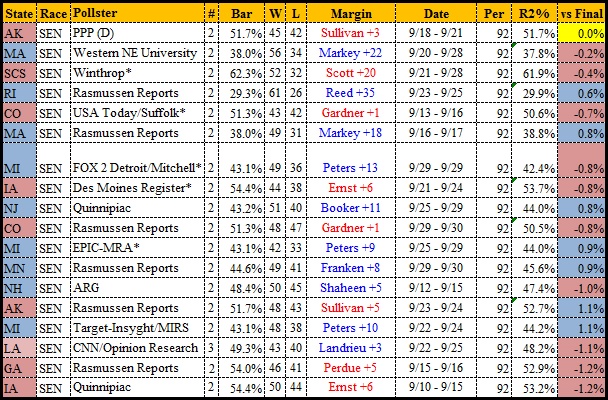 Eighteen late-September polls were within 1.2 points of the final result, including PPP nailing the final margin of Dan Sullivan’s win in Alaska, a notoriously hard state to poll. Rasmussen had six of these polls; while Rasmussen’s national job-approval polls have become a recurring outlier in painting President Obama as consistently more popular than in any other poll, its state-level polls had some good stretches in 2014.
October 1-9 Senate Polls
Given the velocity of the campaign, I broke the last month into four segments. Also, October is close enough to the finish line to add another wrinkle: besides measuring the polls against the final result, we can look at how polls deviated from the final poll average to get a sense of which polls stood out either as ahead of the herd or way behind it.
We have 74 polls concluded the first nine days of October. Seventeen of those were still five or more points off the end result, and 16 of those 17 underestimated Republicans.
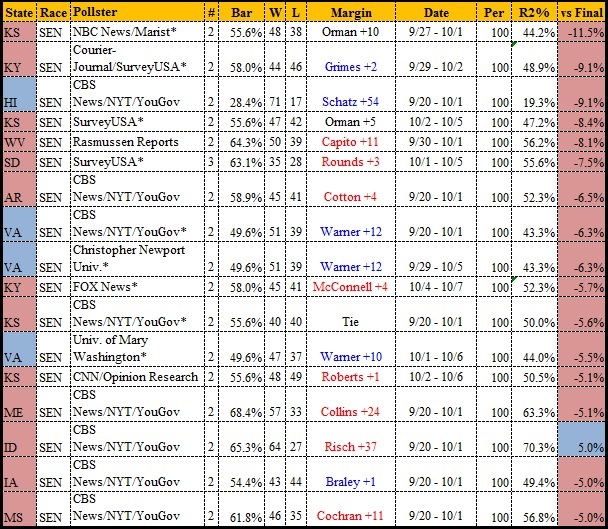 NBC News/Marist had Orman up 10 in a race he lost by 10 a month later. And SurveyUSA had two clunkers, in Kentucky and South Dakota, one of which would turn out in combination with a second poll the following week to be the second great poll-driven distraction of 2014: the brief Democratic excitement over the idea that Mike Rounds might be in trouble in South Dakota. The SurveyUSA poll still had Rounds getting over 55 percent of the two-party vote, not wholly inconsistent with the 63 percent he would get on election day, but it had Pressler getting 32 percent of the vote, a 20-point surge compared to the prior YouGov poll and nearly double what Pressler would draw on election day.
The worst-polls chart looks different if you measure it against the final RCP average:
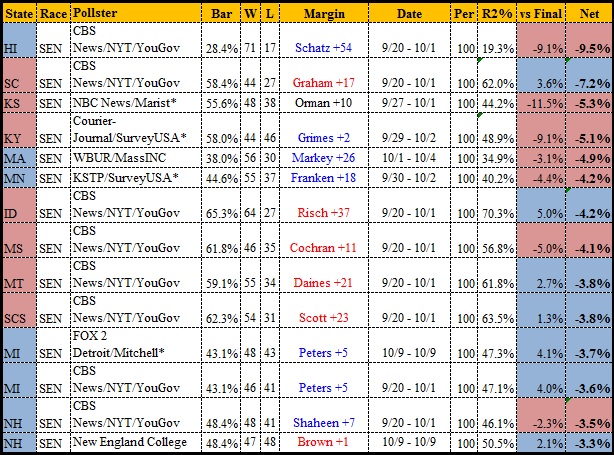 Here, it’s more dominated by YouGov polls of uncompetitive races, but we still see the NBC News/Marist Kansas poll and the SurveyUSA Kentucky poll. As for the best polls of early October, there are fewer really close ones, just seven polls out of 74 within one point, but 17 within 1.5 (including eight YouGov polls), topped by New England College nailing the New Hampshire race.
 Adjusted for the final RCP average, the best polls list here is even more dominated by YouGov polls, which, whatever their vices, did not seem to follow the herd the way other pollsters did. On the other hand, some of these polls simply replicated errors that YouGov and others would repeat in thinly-polled races. Fox News gets points here for having one of the first two-way polls showing Roberts ahead of Orman.
October 10-19 Senate Polls
We have 40 polls for the second ten days of October, the number again dropping off whenever YouGov’s cheap, plentiful polling isn’t in the field. Thirteen of these come in for the obloquy of missing the final result by three points or more, all 13 by underestimating Republicans in races that Republicans ultimately won:
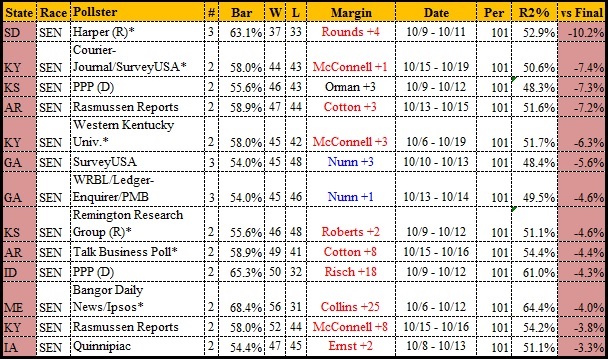 The Harper poll of South Dakota (ironically, a poll by a Republican pollster) set off the avalanche that the SUSA poll had teed up. Where the previous South Dakota poll had pumped up Larry Pressler, this one showed the Democrat, Rick Weiland, just four points back. Weiland’s support was remarkably consistent throughout the year. He never once polled outside the 26-33 range, the polling average was almost always right around 30, it ended at 30, and he finished the voting at 29.5, consistent with the Democrat base vote in the state: Corinna Robinson got 33.5 percent in South Dakota’s at-large House race, Susan Wismer got 25.4 percent in South Dakota’s race for governor. But just one poll showing him four points back of Rounds set off shock waves. The DSCC immediately poured $1 million in scarce resources into South Dakota. Influential liberal bloggers were excited:
The fact that SD-Sen is in contention is all the proof you need that there’s no GOP wave in 2014
— Markos Moulitsas (@markos) October 8, 2014
Okay, don’t look now. But South Dakota may now be in play for Senate. http://t.co/Li1XFoz4gr
— Josh Marshall (@joshtpm) October 8, 2014
They weren’t just excited; they exhorted their readers to donate hundreds of thousands of dollars and activist time to the South Dakota race:
9,100 members of the Daily Kos community have given $218K over the last five days to hold South Dakota Senate seat https://t.co/i74uXMezeM
— Markos Moulitsas (@markos) October 16, 2014
Rick Weiland raised $400K since end of September. Daily Kos community raised $113K of that.
— Markos Moulitsas (@markos) October 17, 2014
Key leaders in get-out-the-Native-vote campaign in South Dakota thank Daily Kos for its support http://t.co/MsvZJkO3rJ
— Daily Kos (@dailykos) October 27, 2014
Daily Kos, in particular, exhorted its readers to pitch in. Just a selection: October 9, from Kos: “Here’s how we’re going to help win South Dakota.” October 13 diary by “poopdogcomedy” on the Harper poll: “SD-Sen: GOP Poll Shows Rick Weiland (D) Closing In On Mike Rounds (R), Pressler (I) Trails Both.” October 13, from Kos: “Going in big for South Dakota GOTV.” October 15, from Kos: “What an awesome bunch of GOTV activists in South Dakota. Aren’t you excited to support them?” October 15, from Meteor Blades: “Control of the Senate runs through South Dakota reservations, and you’re helping GOTV.” October 16, from the DailyKos Editors: “New Weiland ad, and what our South Dakota GOTV donations are buying.” October 16, from Kos: “Republicans grudgingly admit their South Dakota candidate is bombing.” October 17, from Meteor Blades: “Boosted by your donations, campaign to get out the Indian vote in South Dakota showing good results.” October 20, from Kos: “South Dakota ground game fleshes out as GOP rushes in reinforcements.” October 21, diary from navajo: “Daily Kos pays people to break the law! Read the latest efforts to get out the SD reservation vote.”
All of this effort was completely wasted on a race Weiland lost by 21 points, a larger margin than Jim Oberweis’ defeat by Dick Durbin in Illinois. In the end, South Dakota exit polls found that the electorate was 2 percent Native American and 94 percent white, with 48 percent of voters saying they “strongly disapprove” of President Obama. Yet, a poll by a Republican pollster drew Democratic grassroots activists away for several critical weeks from actually tight races like North Carolina to a doomed head-fake in South Dakota. That, to me, is a far bigger polling miss than polls that disappeared in a few days without a trace.
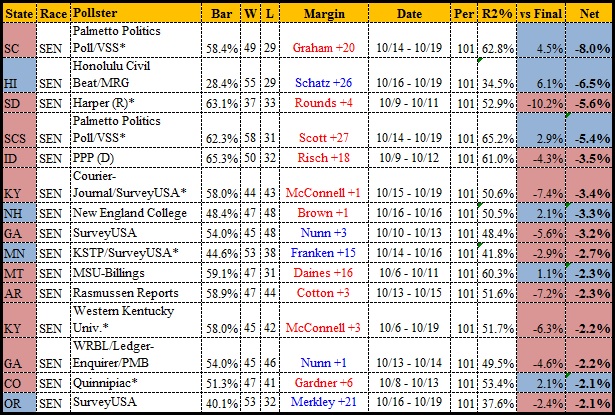
The worst polls list shakes out a little differently when adjusted by the final RCP average, but the Harper South Dakota poll still features prominently.
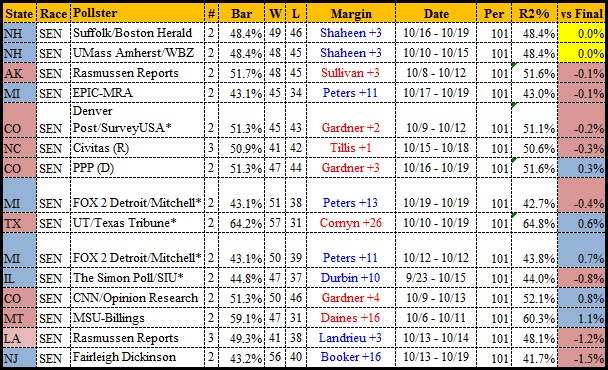
 As for the best polls of this period, 15 of the 40 polls were less than two points off the final results, and while a number of pollsters are represented here—Suffolk, SurveyUSA, PPP, Rasmussen—what sticks out is the states that were coming into clearer focus (New Hampshire, Colorado, Michigan), the exception being Civitas in North Carolina while Hagan was still consistently ahead.
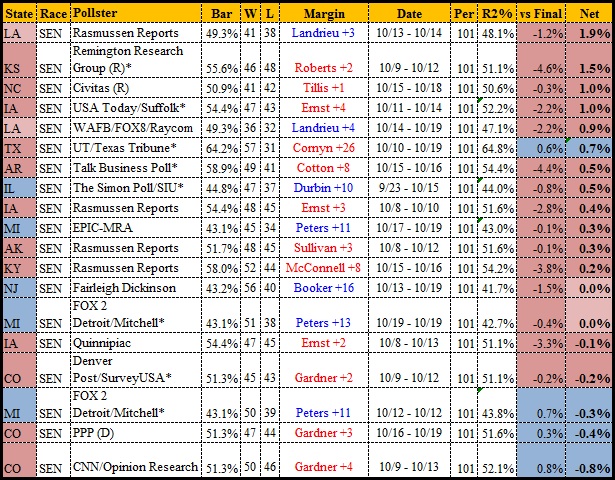
 The Civitas poll finishes third, however, against the final poll average:
 October 20-29 Senate Polls
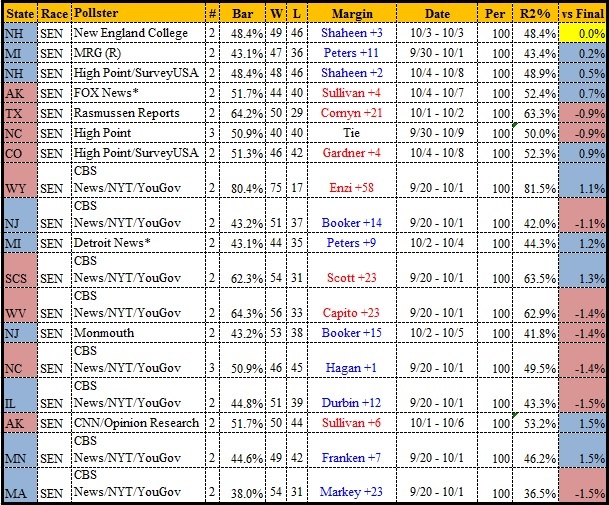
We have a dam-breaking 101 polls for the second ten days of October. Twenty-one of those polls, very late in the game for excuses, still managed to miss the final result by five points or more, all 21 of them by underestimating Republicans:
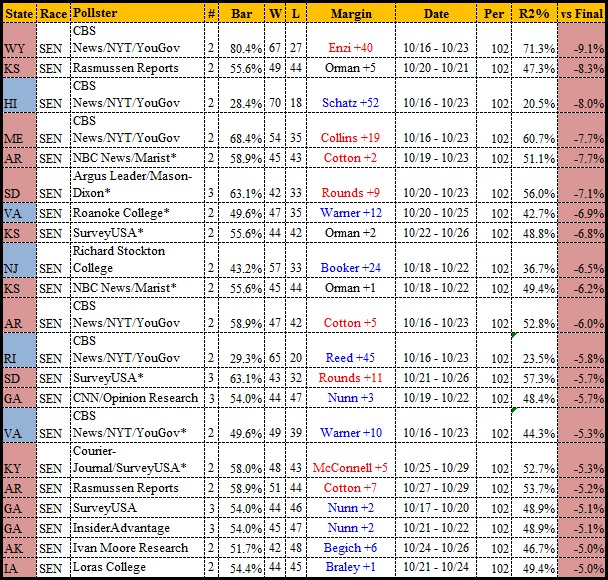 Six of the 21 were YouGov polls, and four were SurveyUSA, plus the widely-mocked “Ivan Moore Research” poll showing Mark Begich up by six. Kansas and Georgia had some especially egregious polls at this stage, given what the final results showed. The list looks different when compared to the poll averages:
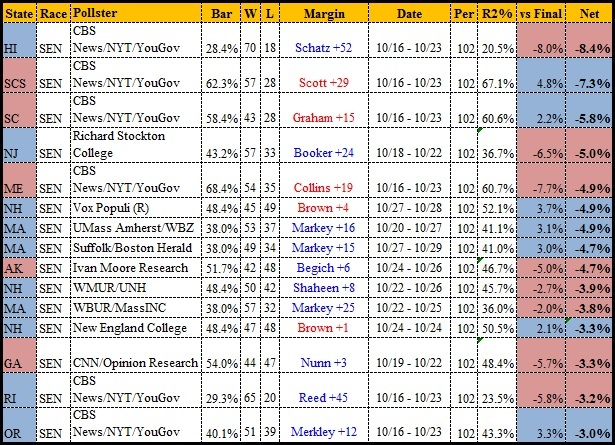 Because so many of the final poll averages underestimated Republicans, the real individual outliers were more likely to be polls that erred in the opposite direction (with the exception of real clunkers like the Ivan Moore Research Alaska poll or the CNN/ORC Georgia poll that had Michelle Nunn up by three). Several New Hampshire polls stick out here—Vox Populi and New England College polls with Brown up, and a WMUR/UNH poll that had Shaheen by eight.
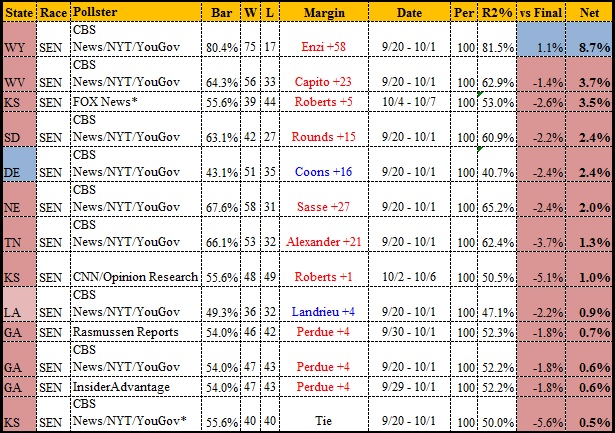
Then there’s the best polls, 23 polls within 1.3 points of the final result, including three that nailed it on the nose (which, if you understand polling, requires a lot of luck and not just a good turnout model): USAToday/Suffolk in Louisiana, Portland Press Herald (a quality local pollster) in Maine, and UMass Lowell/7News in New Hampshire.
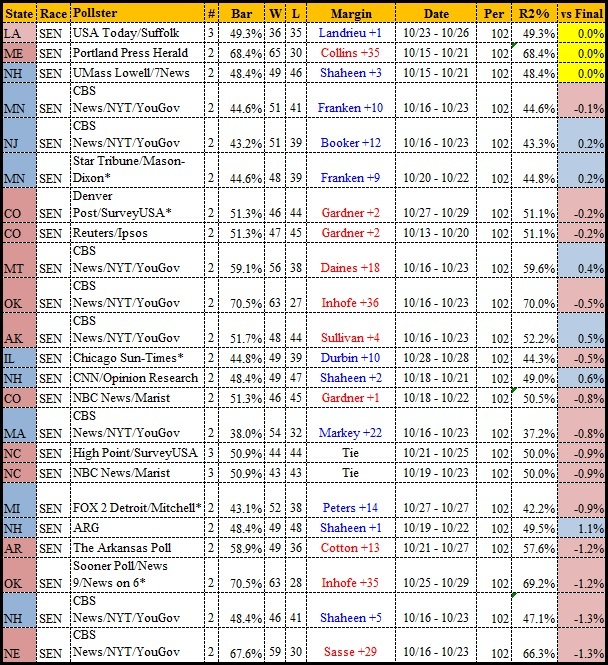 Eight of these are YouGov polls—as noted throughout here, YouGov did a huge number of polls, so while a lot of them were terrible, many were also quite good. Volume over quality. What about against the final RCP average (a challenge, since this late in the game, most of these polls were incorporated in that average)?
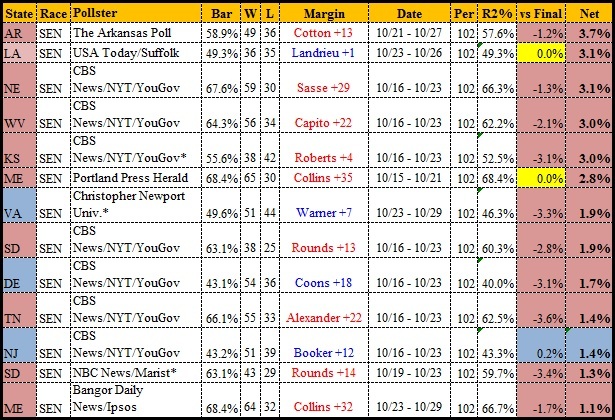 Besides a bunch of YouGov polls and the aforementioned on-the-nose results, what shines here is The Arkansas Poll that caught Tom Cotton pulling away and Christopher Newport University, which as the last pollster to take the field in the Virginia Senate race was the only one calling it as a single-digit race. Although there was one other poll made public, RCP didn’t include the much-maligned Vox Populi poll that had Warner’s lead down to four; not without reason, the Republican Vox Populi firm touts its record of success in a number of races, other than the New Hampshire races, but as we’ve seen it had its ups and downs this season as well. And we now know that Republican pollster Gravis spiked a poll showing Gillespie tied with Warner at the end of the race and that Hampton University declined to publish a final poll it took in the Virginia Senate race, although at this writing it’s unclear if that poll also caught Gillespie’s momentum.
October 30-November 3 Senate Polls
Polls in the last five days of the race are often seen by cynics, not without reason, as CYA season for pollsters to cover up failures earlier in the year. But some polls clearly did not accomplish that task. Of the 44 final polls, 14 were off the final results by 3.5 points or more, 13 of the 14 underestimating Republicans, all 13 of those in hotly contested races the Republican won (or, in the case of Louisiana, where Republicans did well enough on election day to make a runoff win look all but inevitable).
 Half of these are PPP polls, and Kansas and Iowa dominate the list. When we compare to the RCP average, the list adds more New England polls, but PPP still has six entrants out of 13:
 There’s the New England College and Rasmussen polls at the opposite ends of the New Hampshire race, but we also see the “herding” effect Silver noted: aside from PPP’s poll in the low-profile Massachusetts Senate blowout, very few of the worst polls were outliers. Instead they were just a few points worse than the herd. But what about the best final polls? Twenty were within two points of the end result, 16 within 1.1 points:
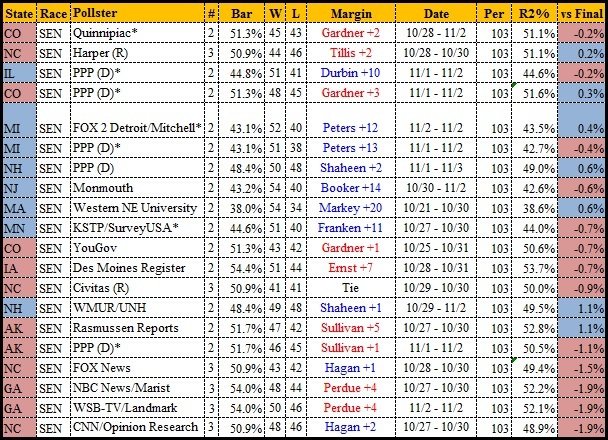 Quinnipiac’s Colorado poll was the closest to the pin of any last-week poll, but PPP also claims four of the seven best spots, one in Colorado and the other three in races won by Democrats. What if we separate polls from the herd?
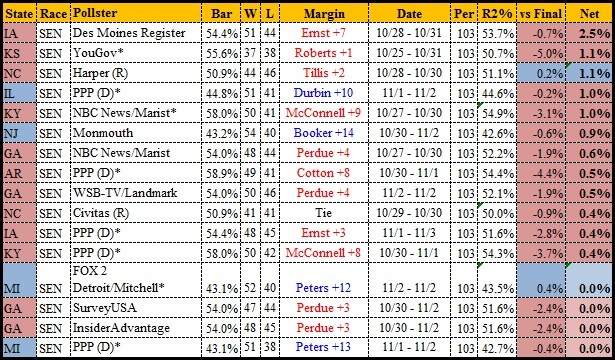 While Illinois is the only one of PPP’s final-week success stories that was more than a half-point better than the average, the poll that stands out as the best race-closing Senate poll of the year is the Des Moines Register poll—run by J. Ann Selzer, long regarded as a “gold standard” state pollster—that saw Joni Ernst up seven points in a race almost everyone else had as a one-to-two-point Ernst lead, but which Ernst went on to win by almost nine points.
The Polling ‘Tragedy of the Commons’ Strikes
Polling is a tough, unforgiving business, and I don’t mean to suggest by picking on so many bad polls, or by comparing polls months ahead of the election to the final results, that large numbers of pollsters don’t know what they are doing or are intentionally biasing their results. Indeed, in a world where it gets ever harder and more costly to locate diverse types of voters while budgets for public polling grow thin, it’s amazing that the public polls haven’t seen even more failures.
As you can see from the above review, while we can fairly pick on some individual pollsters, it’s also just inevitably true that high-volume national operations like YouGov, PPP, Rasmussen, and SurveyUSA are going to have plenty of failures as well as plenty of success stories, and their relative success rates may vary from year to year depending how the national turnout environment meshes with their particular (and differing) approaches to locating and screening poll respondents.
But given the increasing prominence of poll aggregators, the future of public polling may well belong not to highly skilled local pollsters who put the time and effort into getting the results right, but to high-volume, low-margin pollsters like YouGov that try to expand the sample size of inputs to the poll averages even at the expense of having much credibility in their individual poll findings. In that kind of “wisdom of crowds” polling industry, we don’t ask pollsters to be accurate, just independent, so that they don’t groupthink their way into repeating each other’s errors.
Silver’s concern about cost-cutting pollsters herding around the averages is valid but, paradoxically, it’s also been exacerbated by RCP, Silver himself, and others in the poll-analysis space (myself included) who have trained consumers of polls to ignore most individual polls (thus reducing their newsworthiness for news organizations and the prestige they carry for universities and professional pollsters like PPP and Rasmussen) in favor of the averages. That’s why he sees it as a “tragedy of the commons”: just as knowing what the polls say influences the voters, it also influences the other pollsters while reducing their incentive to invest in improving their own product. It turns out that polling isn’t so different than other businesses, in which the quality of the product deteriorates when the producers have trouble monetizing it.
The alternative is the “insider-trading” model of polling: the idea that partisan pollsters can produce more accurate public polls because they are privy to more sophisticated and costly private polls and can “herd” around those, a practice that increases their accuracy at the expense of transparency in why their results come out that way. Organizing For America had a superior proprietary polling operation in 2012, so naturally any pollster who knew what OFA was seeing could free-ride on that to look more accurate. But the downside of the insider trading model is that it leaves accurate public polling entirely in the hands of pollsters with an agenda that may place partisan propaganda and psyop above accuracy. And the only remedy for that is to shine the light of accountability on their polls once the election returns are in.


